Download presentation
Presentation is loading. Please wait.

1
Critical appraisal 張祐泟

2
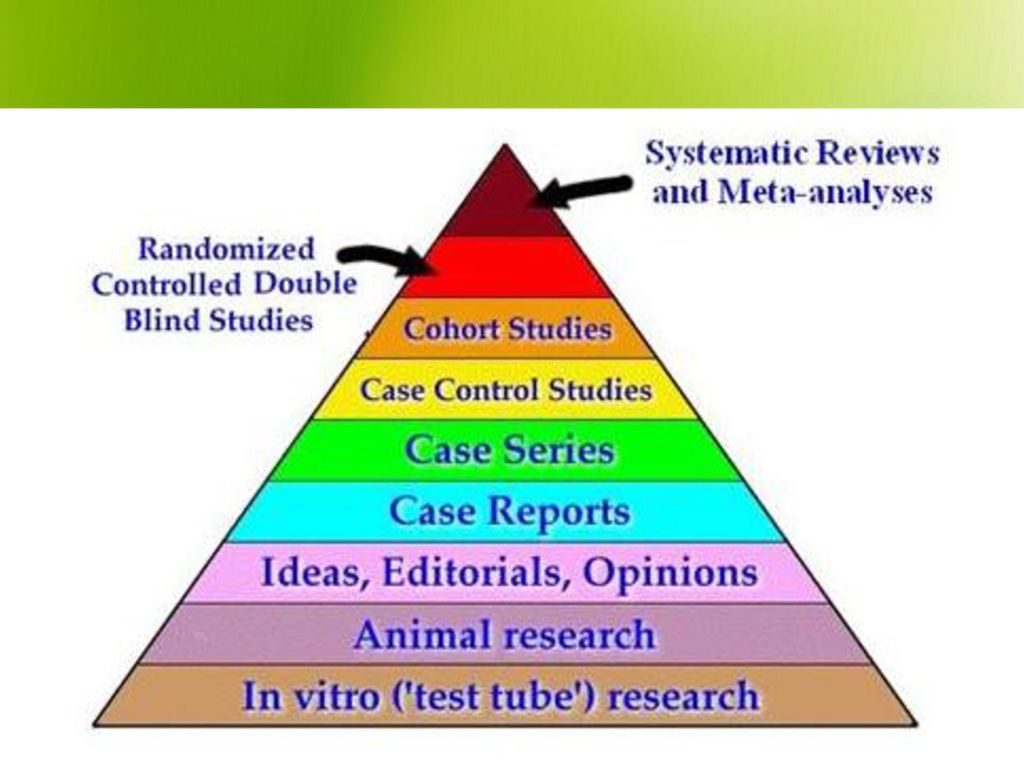
EBM 五大步驟 Asking answerable question Finding the best evidence Appraising the evidence Making a decision Evaluating your performance

3
在評讀之前須先瞭解各種研究是屬何種設計方式,研究方法介紹
醫學統計學介紹 評讀方法和工具 如何應用

4
所有研究 描述性研究 分析性研究 橫切調查 質性研究 介入性試驗 觀察性分析 隨機對照試驗 世代研究 交叉設計 橫切研究 病例對照研究

5
簡介幾種常用的研究設計 系統性回顧 隨機對照試驗 交叉設計 世代研究 病例對照研究 橫切研究

6
系統性回顧 系統性回顧 隨機對照試驗 交叉設計 世代研究 病例對照研究 橫切研究 試驗A 試驗B 試驗C 試驗D 整合分析

7
系統性回顧 (Systematic review)
系統性回顧 隨機對照試驗 交叉設計 世代研究 病例對照研究 橫切研究 系統性回顧 (Systematic review) 集合多個目的和方法十分相近的研究報告整合在一起進行分析 若有將各研究的結果合併進行統計則稱為 meta-analysis (後設分析)
 集合多個目的和方法十分相近的研究報告整合在一起進行分析. 若有將各研究的結果合併進行統計則稱為. meta-analysis (後設分析)")
8
隨機對照試驗 (Ramdomized Control Studies)
系統性回顧 隨機對照試驗 交叉設計 世代研究 病例對照研究 橫切研究 追蹤及分析治療結果 隨機分組 病人族群 治療組 對照組

9
隨機對照試驗 研究對象:某種疾病的患者或具備某種特徵的人 研究內容: 以隨機方式將受試者分為治療組及控制組
系統性回顧 隨機對照試驗 交叉設計 世代研究 病例對照研究 橫切研究 隨機對照試驗 研究對象:某種疾病的患者或具備某種特徵的人 研究內容: 以隨機方式將受試者分為治療組及控制組 前者接受試驗性的治療,後者接受傳統治療或安慰劑(外表如試驗藥物但實際不含活性藥物) 比較兩組受試者的狀況而了解試驗藥物的療效及安全性 首選領域:探討某種處置或藥物之效益
 比較兩組受試者的狀況而了解試驗藥物的療效及安全性. 首選領域:探討某種處置或藥物之效益.")
10
隨機對照試驗 Advantages: 無偏誤地均攤干擾因素 較能作盲性試驗 隨機分配有利於統計分析 Disadvantages:
系統性回顧 隨機對照試驗 交叉設計 世代研究 病例對照研究 橫切研究 隨機對照試驗 Advantages: 無偏誤地均攤干擾因素 較能作盲性試驗 隨機分配有利於統計分析 Disadvantages: 耗費時間和金錢 志願者的偏差 時有倫理問題

11
交叉設計 (Crossover Design)
系統性回顧 隨機對照試驗 交叉設計 世代研究 病例對照研究 橫切研究 追蹤及比較兩種用藥的結果 隨機分組 交換用藥 病人族群 治療用藥 對照用藥

12
交叉設計 研究對象:某種疾病的患者或具備某種特徵的人 研究內容: 受試者會先後接受試驗治療及控制治療
系統性回顧 隨機對照試驗 交叉設計 世代研究 病例對照研究 橫切研究 交叉設計 研究對象:某種疾病的患者或具備某種特徵的人 研究內容: 受試者會先後接受試驗治療及控制治療 受試者被隨機分配先接受其中一種治療,在經過交叉點後便接受另一種治療 評估指標為比較受試者在接受兩種不同治療時所發生的效應 設計限制:類試驗僅限於相關治療之效力屬可逆性者

13
交叉設計 Advantages: 因所有受試者均與自己比較,減少誤差而所需受試者人數可以較少 所有受試者均有接受治療(起碼有一段時間)
系統性回顧 隨機對照試驗 交叉設計 世代研究 病例對照研究 橫切研究 交叉設計 Advantages: 因所有受試者均與自己比較,減少誤差而所需受試者人數可以較少 所有受試者均有接受治療(起碼有一段時間) 統計方法可比照隨機分配試驗者 試驗盲性可以維持 Disadvantages: 所有受試者在某一段時間會接受安慰劑或非試驗性的治療 廓清期(washout period)或許很長或尚不清楚 不能用於具永久效應的治療
 統計方法可比照隨機分配試驗者. 試驗盲性可以維持. Disadvantages: 所有受試者在某一段時間會接受安慰劑或非試驗性的治療. 廓清期(washout period)或許很長或尚不清楚. 不能用於具永久效應的治療.")
14
世代研究 (Cohort Study) 探討危險因子的角色 長期追蹤 具危險因子者 無危險因子者 發病者
系統性回顧 隨機對照試驗 交叉設計 世代研究 病例對照研究 橫切研究 探討危險因子的角色 長期追蹤 具危險因子者 無危險因子者 發病者

15
世代研究 研究對象:從資料庫中找出曾經曝露及沒有曝露於研究標科技或因素的兩個族群
系統性回顧 隨機對照試驗 交叉設計 世代研究 病例對照研究 橫切研究 世代研究 研究對象:從資料庫中找出曾經曝露及沒有曝露於研究標科技或因素的兩個族群 研究內容:研究者不涉入任何處置,僅作追蹤以了解兩個族群的結果及預後 首選領域:探討某預期風險因素對預後影響

16
世代研究 Advantages: 較無倫理的顧慮 可對兩組受試者的條件作配對
系統性回顧 隨機對照試驗 交叉設計 世代研究 病例對照研究 橫切研究 世代研究 Advantages: 較無倫理的顧慮 可對兩組受試者的條件作配對 可建立timing and directionality of events 納入條件及結果評估能標準化 較RCT在行政上較為簡易及便宜 Disadvantages: 對照組可能不易識別 可能潛藏著干擾因素 難以保持盲性 欠缺隨機分組 研究罕見疾病時仍需頗大的個案數目或長久的追蹤時間

17
病例對照研究 (Case-Control Studies)
系統性回顧 隨機對照試驗 交叉設計 世代研究 病例對照研究 橫切研究 探討危險因子的角色 回顧及分析病史 患有某病者 未患該病者 具危險因素者

18
病例對照研究 研究對象:某種疾病的疾患(研究組)與未罹病的人(對照組)
系統性回顧 隨機對照試驗 交叉設計 世代研究 病例對照研究 橫切研究 研究對象:某種疾病的疾患(研究組)與未罹病的人(對照組) 研究內容:比較兩組曾經曝露於某些推測的危險因子之狀況,進而了解該等因子與疾病的關係
與未罹病的人(對照組) 研究內容:比較兩組曾經曝露於某些推測的危險因子之狀況,進而了解該等因子與疾病的關係.")
19
病例對照研究 Advantages: 快速及便宜 對罕見疾病或曝露效應需很長期的追蹤等情況唯一較實際可行的方法
系統性回顧 隨機對照試驗 交叉設計 世代研究 病例對照研究 橫切研究 病例對照研究 Advantages: 快速及便宜 對罕見疾病或曝露效應需很長期的追蹤等情況唯一較實際可行的方法 較一般橫斷研究需要較少的受試者. Disadvantages: 依賴回憶或紀錄來判斷曝露情形 存有許多干擾因素 對照組的選擇不易 潛在偏誤:回憶、取樣

20
橫切研究 (Cross-Sectional Survey)
系統性回顧 隨機對照試驗 交叉設計 世代研究 病例對照研究 橫切研究 分析特定族群中各種異常與族群特色之相關 某一時間點 檢查某些項目 特定族群 具一項或多項危險因素、罹病或檢查異常者

21
橫切研究 研究對象:某一時間點中之特定族群 研究內容:檢視該族群中疾病與欲探討變項間的關係 首選領域:探討疾病盛行率、診斷檢測方法的精確度
系統性回顧 隨機對照試驗 交叉設計 世代研究 病例對照研究 橫切研究 橫切研究 研究對象:某一時間點中之特定族群 研究內容:檢視該族群中疾病與欲探討變項間的關係 首選領域:探討疾病盛行率、診斷檢測方法的精確度

22
橫切研究 Advantages: 便宜及簡單 倫理上安全 Disadvantages: 只了解是否相關,但無法確立因果關係 回憶易生偏誤
系統性回顧 隨機對照試驗 交叉設計 世代研究 病例對照研究 橫切研究 橫切研究 Advantages: 便宜及簡單 倫理上安全 Disadvantages: 只了解是否相關,但無法確立因果關係 回憶易生偏誤 干擾因素分配可能不均勻 bias 組別大小可能會不對等

23
嚴格評讀證據(for therapy) 研究方法的探討: Validity (Reliability) 效度/信度
Can we believe it ? 研究結果的分析: Importance (Impact) 重要性 We believe it ! But does it matter? 如何在臨床運用: Practice (Applicability) 臨床適用性 If we believe it ‐ does it apply to our patients?
 重要性. We believe it ! But does it matter 如何在臨床運用: Practice (Applicability) 臨床適用性. If we believe it ‐ does it apply to our patients")
24
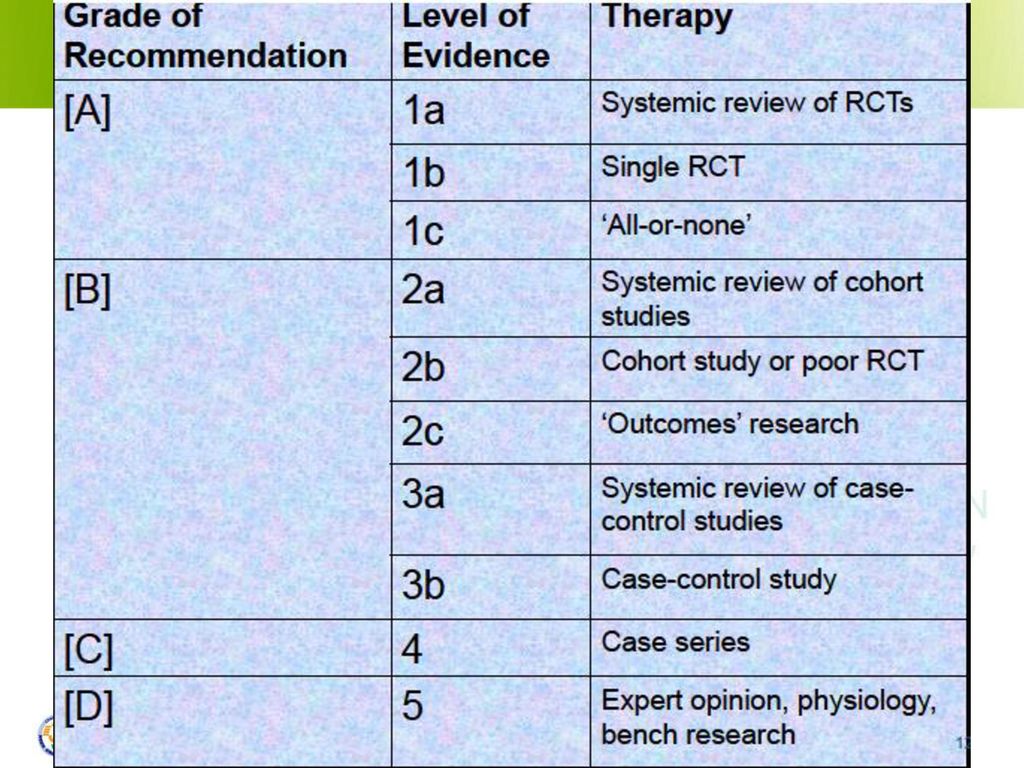
依問題性質選最佳的研究方法 Different study design has different level of evidence, the best quality study design for each question: Frequency ‐ Prevalence (case control), Incidence (cohort) Etiology / Harm ‐ cohort Diagnosis – case control Prognosis ‐ cohort Treatment / Intervention ‐ RCT
, Incidence (cohort) Etiology / Harm ‐ cohort. Diagnosis – case control. Prognosis ‐ cohort. Treatment / Intervention ‐ RCT.")
25
解答不同類型臨床問題之最佳研究設計 Question type (問題類型) Study design (研究設計)
Diagnostic test 診斷性檢驗或檢查 Prospective, blinded cross-sectional study comparing with gold standard 前瞻性、盲法、與黃金標準進行比較之斷面研究 Prognosis 預後 Cohort study > Case control study > Case series study 世代研究 > 病例對照研究 > 病例系列研究 Etiology 病因 Therapy 治療 Randomised control trial (RCT) 隨機對照試驗 Prevention 預防 Cost effectiveness 成本效益 Economic analysis 經濟分析
 隨機對照試驗. Prevention. 預防. Cost effectiveness. 成本效益. Economic analysis. 經濟分析.")
30
探討醫學統計學 假設檢定的核心是推論H0 當H0是真實的,拒絕H0就是錯誤的;不拒絕H0則是正確的

31
檢定水準 α : 拒絕H0時的最大允許誤差, α 是拒絕了實際上成立的H0的概率
習慣上常用的檢定水準為 α= 0.05 若P ≦ α 則拒絕H0 ,接受H1 ,可以認為樣本與群體的差別不僅僅是抽樣誤差造成的,可能存在本質上的差別,屬顯著差別 P 質的大小代表了多大的誤差拒絕H0 P 質越小,風險越小

32
拒絕H0 ,接受 H1 不拒絕H0 H0 真實 I 型錯誤 (α ) 正確推論 (1-α ) H0不真實 正確推論 (1-β) II 型錯誤 (β)
 正確推論 (1-α ) H0不真實 正確推論 (1-β) II 型錯誤 (β)")
33
H H1

34
I 型錯誤概率用α表示 II 型錯誤概率用β表示 Power of a test: 1- β

35
醫學研究的目的之一即對未知的群體參數進行估計
點估計 (point estimation): 是直接用樣本統計量作為對應的群體參數的估計值 例如: 2011年對大台南市7歲男童的身高作調查,真正母群體的平均身高及身高分佈不易獲取,隨機抽取120名測得平均身高為 cm, 標準差 s= 4.75 cm,這就是點估計
: 是直接用樣本統計量作為對應的群體參數的估計值. 例如: 2011年對大台南市7歲男童的身高作調查,真正母群體的平均身高及身高分佈不易獲取,隨機抽取120名測得平均身高為 cm, 標準差 s= 4.75 cm,這就是點估計.")
36
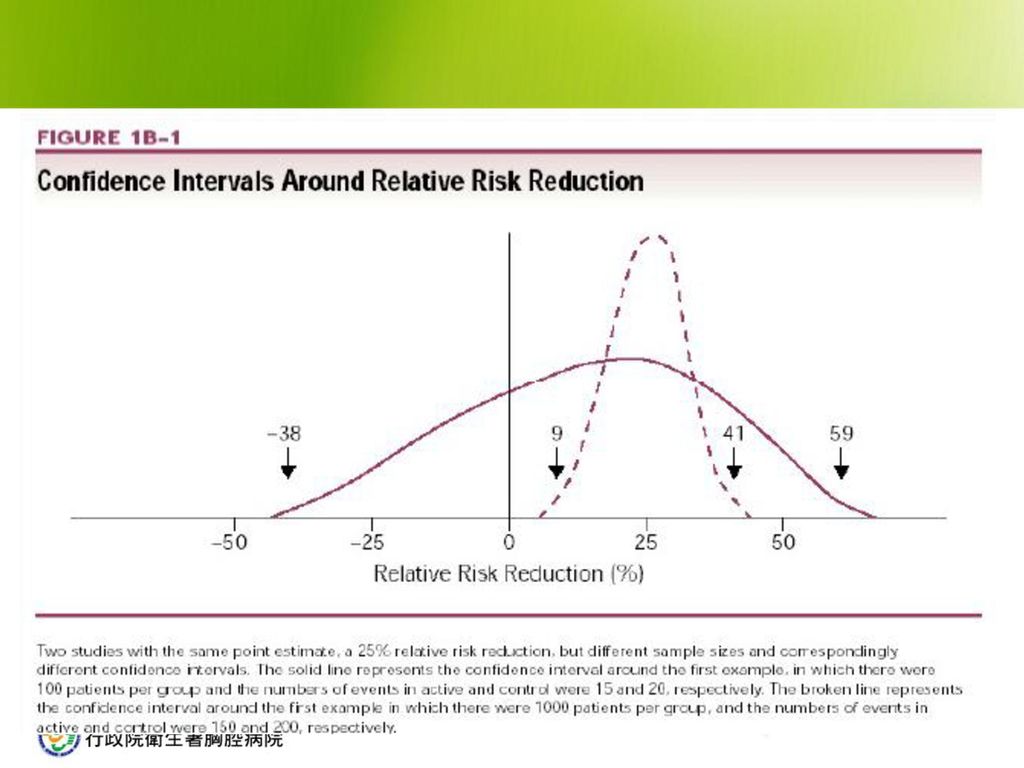
區間估計是按一定的概率或可信度 (1-α) 用一個區間估計母群體參數所在範圍,這個範圍稱作可信度為 (1- α) 的信賴區間 (confidence interval, CI)
例如取α= 0.05, 從一母群體中重複抽取100個樣本,理論上有95個包含群體均數,有5個不包含群體均數

40
Diagnostic test disease non-disease positive A B negative C D
Sensitivity: A/A+C Specificity: D/B+D Positive predictive value(PPV): A/A+B Negative predictive value(NPV): D/C+D
: A/A+B. Negative predictive value(NPV): D/C+D.")
41
In therapy study Relative risk (RR) : Odd ratio Relative risk reduction (RRR) Absolute risk reduction (ARR) Number needed to treat (NNT): 1/ARR
: 1/ARR.")
42
Relative risk(相對風險)/ Risk ratio (風險比)
用A藥治療一疾病 100 人就有一個會產生副作用, Relative risk: 1/100= 0.01 用B藥治療一疾病 50 人就有一個會產生副作用, Relative risk: 1/50= 0.02 B藥相較於A藥的 risk ratio= 0.02/0.01= 2

43
Odds (勝算) / Odds ratio (勝算比)
用A藥治療一疾病, 100 人就有一個會產生副作用, 產生副作用的odds (勝算)= 1:99=1/99=
= 1:99=1/99=")
44
什麼是odds ratio( 勝算比): Odds ratio: 病人組中對某危險因子暴露的勝算除以對照組的勝算 舉例: 兩勝算相比。如罹患A疾病機率是 0.5 , 罹患B疾病機率是 0.2; 以勝算來比較, 則罹患A疾為 1(=0.5/0.5) 罹患B疾為1/4 (=0.2/0.8) 罹患A疾和罹患B疾的勝算比(odds ratio), 即: 1比 ¼ 為 4。 勝算比為1表示兩組的風險是沒有差別的
 罹患A疾和罹患B疾的勝算比(odds ratio), 即: 1比 ¼ 為 4。 勝算比為1表示兩組的風險是沒有差別的.")
45
Effect of Therapy (治療效果)
一年的死亡人數 一年的存活人數 接受某治療 300 700 不接受某治療 800 200 實驗組事件發生率 (EER) = 300 / ( ) = 30% 對照組事件發生率(CER) = 800 / ( ) = 80% 風險比 (Risk Ratio, RR) = EER / CER = 0.3 / 0.8 = 0.375 絕對危險性降低度 (ARR) = CER – EER = 80% - 30% = 50% 相對風險性降低度 (RRR) = CER – EER / CER = (80% - 30%) / 80% = 62.5% EER: Experimental event rate CER: Control event rate ARR: Absolute risk reduction RRR: Relative risk reduction
 = 300 / ( ) = 30% 對照組事件發生率(CER) = 800 / ( ) = 80% 風險比 (Risk Ratio, RR) = EER / CER = 0.3 / 0.8 = 絕對危險性降低度 (ARR) = CER – EER = 80% - 30% = 50% 相對風險性降低度 (RRR) = CER – EER / CER = (80% - 30%) / 80% = 62.5% EER: Experimental event rate. CER: Control event rate. ARR: Absolute risk reduction. RRR: Relative risk reduction.")
46
Number Needed to Treat (NNT) “益一需治數"
“益一需治數”:為了預防一個不良結果 或減少一人死亡所需治療的病人數 例如:治療五人可減少一人死亡 VS 治療兩千人可減少一人死亡 NNT = 1 / ARR or 100 / ARR (%)
")
47
How large was the treatment effect 治療效果有多大?
某一研究追蹤二年,對照組死亡率15%,治療組死亡率10%, 結果的呈現方式有: 呈現方式 代表的意義 Relative Risk (相對風險) RR = 0.10 / 0.15 = 0.67 治療組發生風險相對於對照組的倍數。RR=1兩組無差別,RR<1治療可降低風險, RR>1治療會增加風險 RR<1表示治療可降低死亡的風險 Absolute Risk Reduction (絕對危險性降低度) ARR = 0.15 – 0.10 = 0.05 or 5% 治療組與對照組發生風險的絕對差異 治療的益處是降低5%的死亡率 Relative Risk Reduction (相對風險性降低度) RRR = 0.05 / 0.15 = 0.33 or 33% Or RRR = 1 – 0.67 = 0.33 or 33% 相對於對照組,治療組降低風險的比率 (最常見的呈現方式) 相對於對照組,治療可以降低死亡的的機率33% Number Needed to Treat (益一需治數) NNT = 1 / ARR = 1 / 0.05 = 20 要預防一位不良結果發生所必需治療的病人數 必需治療20位病人2年才能預防1人死亡
 RR = 0.10 / 0.15 = 治療組發生風險相對於對照組的倍數。RR=1兩組無差別,RR<1治療可降低風險, RR>1治療會增加風險. RR<1表示治療可降低死亡的風險. Absolute Risk Reduction. (絕對危險性降低度) ARR = 0.15 – 0.10 = 0.05 or 5% 治療組與對照組發生風險的絕對差異. 治療的益處是降低5%的死亡率. Relative Risk Reduction. (相對風險性降低度) RRR = 0.05 / 0.15 = 0.33 or 33% Or RRR = 1 – 0.67 = 0.33 or 33% 相對於對照組,治療組降低風險的比率. (最常見的呈現方式) 相對於對照組,治療可以降低死亡的的機率33% Number Needed to Treat. (益一需治數) NNT = 1 / ARR = 1 / 0.05 = 20. 要預防一位不良結果發生所必需治療的病人數. 必需治療20位病人2年才能預防1人死亡.")
48
Critically Appraising the Evidence (VIP)
Critically appraising the evidence for its (VIP) Validity (closeness to the truth) 1. Was the assignment of patients to treatment randomized? 2. Was follow-up of patients sufficiently long and complete? (> 80%) 3. Were all patients analyzed in the groups to which they were randomized? (ITT, Intension To Treat analysis) 4. Were patients and clinicians kept blind to treatment? 5. Were groups treated equally, apart from the experimental therapy? 6. Were the groups similar at the start of the trial? Validity: selection bias, information bias, confounding Reliability of measurement: intraobserver, interobserver, internal consistency SD, variance, 95% CI (confidence interval), p value Impact (size of the effect): NNT (number needed to treat) = 1/ARR (absolute risk reduction) NNH (number needed to harm) = 1/ARI (absolute risk increase) Applicability (usefulness in our clinical practice) Integrating the evidence with our clinical expertise and patients’ values and preferences.
 Validity (closeness to the truth) 1. Was the assignment of patients to treatment randomized 2. Was follow-up of patients sufficiently long and complete (> 80%) 3. Were all patients analyzed in the groups to which they were. randomized (ITT, Intension To Treat analysis) 4. Were patients and clinicians kept blind to treatment 5. Were groups treated equally, apart from the experimental therapy 6. Were the groups similar at the start of the trial Validity: selection bias, information bias, confounding. Reliability of measurement: intraobserver, interobserver, internal consistency. SD, variance, 95% CI (confidence interval), p value. Impact (size of the effect): NNT (number needed to treat) = 1/ARR (absolute risk reduction) NNH (number needed to harm) = 1/ARI (absolute risk increase) Applicability (usefulness in our clinical practice) Integrating the evidence with our clinical expertise and patients’ values and preferences.")
49
The RAMMbo* acronym: assessing study bias
P Recruitment Allocation Maintenance Measurement of outcomes blind or objective P E C O T E C Cover RAMMbo when I introduce critical appraisal O T

50
+ - + - I G CG A B C D QUESTION: DESIGN: Participants Selection?
VALIDITY Participants Selection? Representative? Allocation? Randomised? comparable groups? Allocation? Intervention Group (IG) & Comparison Group (CG) I G CG Maintenance of allocation? + - Maintenance? treated equally? compliant? Measurements blind subjective? OR objective? A B Outcome + C D - Measurement of outcomes? 50
 & Comparison Group (CG) I G. CG. Maintenance of allocation + - Maintenance treated equally compliant Measurements blind subjective OR objective A. B. Outcome. + C. D. - Measurement of outcomes 50.")
51
Critical Appraisal Skills Programme (CASP)
10 questions to help you make sense of randomised controlled trials How to use this appraisal tool Three broad issues need to be considered when appraising the report of a randomised controlled trial: • Is the trial valid? • What are the results? • Will the results help locally?

52
1. Did the study ask a clearly-focused question
1. Did the study ask a clearly-focused question? -> Yes, Can’t tell, No Consider if the question is ‘focused’ in terms of: – the population studied – the intervention given – the outcomes considered

53
2. Was this a randomised controlled trial (RCT) and was it appropriately so? -> Yes, Can’t tell, No Consider: – why this study was carried out as an RCT – if this was the right research approach for the question being asked

54
3. Were participants appropriately allocated to intervention and control groups? 4. Were participants, staff and study personnel ‘blind’ to participants’ study group? 5. Were all of the participants who entered the trial accounted for at its conclusion? 6. Were the participants in all groups followed up and data collected in the same way?

55
7. Did the study have enough participants to minimise the play of chance? 8. How are the results presented and what is the main result? 9. How precise are these results? 10. Were all important outcomes considered so the results can be applied?

56
Will the Results Help Me in Caring for My Patients ?
Are the people in the study like my patient ? Age General state of health Type and severity of disease process Time in the course of the disease Did the study cover all aspects of problem ? eg treatment effect on symptom relief, quality of life, mortality etc Is the treatment feasible in my setting ? Will the potential benefits of treatment outweigh the potential harms of treatment for my patients ? Does it suggest a clear and useful plan of action ? Help to clarify a patient’s prognosis Suggest a useful plan to improve patient’s state of health

57
Systematic reviews Meta-analysis (統合分析)
If the results of the individual studies are similar Gives weighted values to each of the individual studies according to their size The individual results of the studies expressed in a standard way, eg relative risk, odds ratio or mean difference between groups Results are displayed in a figure called “forest plot” Exploring heterogeneity (檢驗差異性) Cochran chi-square ( Cochran Q test) Definite heterogeneity (確定有差異) Cochran Q ( P < 0.1 ) Possible heterogeneity (可能有差異) Cochran Q is not statistically significant Cochran Q / degrees of freedom (Q/df) > 1 Heterogeneity unlikely (有差異機會不大) Q/df < 1
 Cochran chi-square ( Cochran Q test) Definite heterogeneity (確定有差異) Cochran Q ( P < 0.1 ) Possible heterogeneity (可能有差異) Cochran Q is not statistically significant. Cochran Q / degrees of freedom (Q/df) > 1. Heterogeneity unlikely (有差異機會不大) Q/df < 1.")
58
Meta-analysis Forest Plot Comparison: Treatment VS Placebo
Outcome: Effect of treatment on mortality Treatment Control OR Weight OR Study n/N n/N (95% CI) % (95% CI) Brown / / (0.42, 1.21) Geoffrey / / (0.51, 0.81) Mason / / (0.46, 0.92) Peters / / (0.31, 4.71) Scott / / (0.42, 1.06) Total (95% CI) / / (0.56, 0.78) .1 .2 1 5 10 Test for heterogeneity chi-square=0.92 df=4 p=0.92 Test for overall effect z= p< Favors treatment Favors control
 % (95% CI) Brown /472 35/ (0.42, 1.21) Geoffrey / / (0.51, 0.81) Mason / / (0.46, 0.92) Peters /81 4/ (0.31, 4.71) Scott /788 46/ (0.42, 1.06) Total (95% CI) 236/ / (0.56, 0.78) Test for heterogeneity chi-square=0.92 df=4 p=0.92. Test for overall effect z=-4.82 p< Favors treatment. Favors control.")
59
Meta-analysis Forest Plot Treatment reduces
Comparison: Treatment VS Placebo Outcome: Effect of treatment on mortality Treatment reduces mortality by 34% Treatment Control OR Weight OR Study n/N n/N (95% CI) % (95% CI) Brown / / (0.42, 1.21) Geoffrey / / (0.51, 0.81) Mason / / (0.46, 0.92) Peters / / (0.31, 4.71) Scott / / (0.42, 1.06) Total (95% CI) / / (0.56, 0.78) .1 .2 1 5 10 Test for heterogeneity chi-square=0.92 df=4 p=0.92 Test for overall effect z= p< Favors treatment Favors control No effect of treatment
 % (95% CI) Brown /472 35/ (0.42, 1.21) Geoffrey / / (0.51, 0.81) Mason / / (0.46, 0.92) Peters /81 4/ (0.31, 4.71) Scott /788 46/ (0.42, 1.06) Total (95% CI) 236/ / (0.56, 0.78) Test for heterogeneity chi-square=0.92 df=4 p=0.92. Test for overall effect z=-4.82 p< Favors treatment. Favors control. No effect of treatment.")
60
Explore Heterogeneity
Eyeball test – Overlap of the confidence intervals of the trials with the summary estimate Cochran Q and Q / df Vertical light blue line through the combined odds ratio crosses the horizontal lines of all the individual studies Treatment Control OR Weight OR Study n/N n/N (95% CI) % (95% CI) Brown / / (0.42, 1.21) Geoffrey / / (0.51, 0.81) Mason / / (0.46, 0.92) Peters / / (0.31, 4.71) Scott / / (0.42, 1.06) Total (95% CI) / / (0.56, 0.78) .1 .2 1 5 10 Test for heterogeneity chi-square=0.92 df=4 p=0.92 Test for overall effect z= p< Cochran Q p=0.92 Q / df = 0.92 / 4 = 0.23 (<1) Favors treatment Favors control
 % (95% CI) Brown /472 35/ (0.42, 1.21) Geoffrey / / (0.51, 0.81) Mason / / (0.46, 0.92) Peters /81 4/ (0.31, 4.71) Scott /788 46/ (0.42, 1.06) Total (95% CI) 236/ / (0.56, 0.78) Test for heterogeneity chi-square=0.92 df=4 p=0.92. Test for overall effect z=-4.82 p< Cochran Q p=0.92. Q / df = 0.92 / 4 = 0.23 (<1) Favors treatment. Favors control.")
61
Thanks for your attention
Happy weekend

Similar presentations
>")


7731-5800 services@customer-support.com.tw The Cochrane Library 碩睿資訊有限公司 (02)7731-5800 services@customer-support.com.tw.>")


>")


