Download presentation
Presentation is loading. Please wait.

1
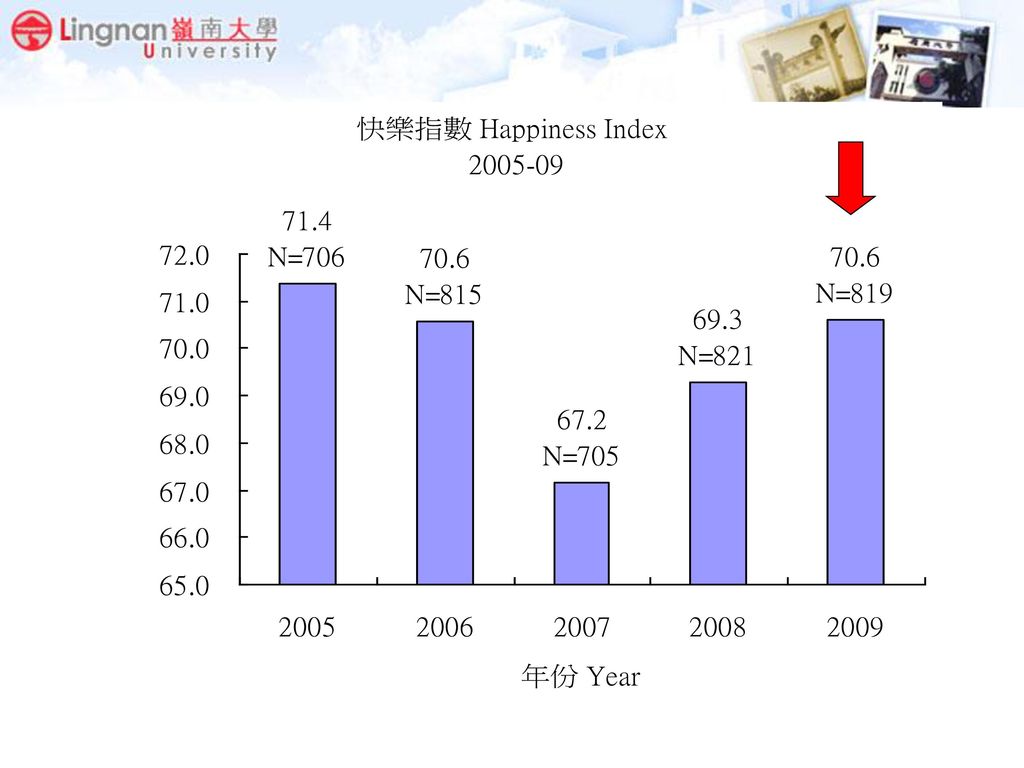
香港快樂指數 Hong Kong Happiness Index 2009
何濼生教授 嶺南大學公共政策研究中心 嶺南大學經濟學系國際銀行與金融碩士課程 Prof Lok Sang HO Director, Centre for Public Policy Studies Master of Science in International Banking and Finance Programme, Department of Economics Lingnan University November 2009

2
The survey was conducted between 9 – 13 Nov 以隨機抽樣電話調查方式進行
調查自2005年首次推出今年為第5次 Launched in 2005, this year is the 5th time for the study 今年調查於2009年11月9日至13日期間進行 The survey was conducted between 9 – 13 Nov 以隨機抽樣電話調查方式進行 The survey was conducted via randomized phone calls 成功訪問了828位年齡21歲以上的香港居民 828 Hong Kong residents aged 21 or above were successfully interviewed 嶺大「香港快樂指數」: 以0-100分作指標,獲取50分以上者屬於「快樂」組別,50分以下屬於「不快樂」組別,愈接近100分,其快樂指數愈高。 On a scale of 0 to 100, an index above 50 suggests that people are happy

7
2005 2006 2007 2008 2009 09年與08年比較 五年平均值 Mean N % 家庭主婦 75.3 118 71.2 110 71.5 103 75.2 134 72.6 141 -3.5% 73.3 退休 78.2 60 100 68.1 79 69.4 81 72.7 96 +4.8% 71.7 經理及行政人員 71.1 92 71.6 143 70.4 105 88 71.3 80 -2.8% 專業人員 72.5 61 71.4 74 68 71 69.7 90 70.5 +1.2% 70.3 文員 69.5 101 68.8 65.9 87 +8.5% 69.6 服務工作及商店銷售人員 65 65.7 77 69.0 70.6 69 +2.3% 69.1 非技術工人 63.4 29 69.8 41 35 60.8 24 64.6 28 +6.3% 64.1 失業、待業 61.8 38 61.9 27 57.5 56.1 23 62.0 50 +10.5% 60.4

8
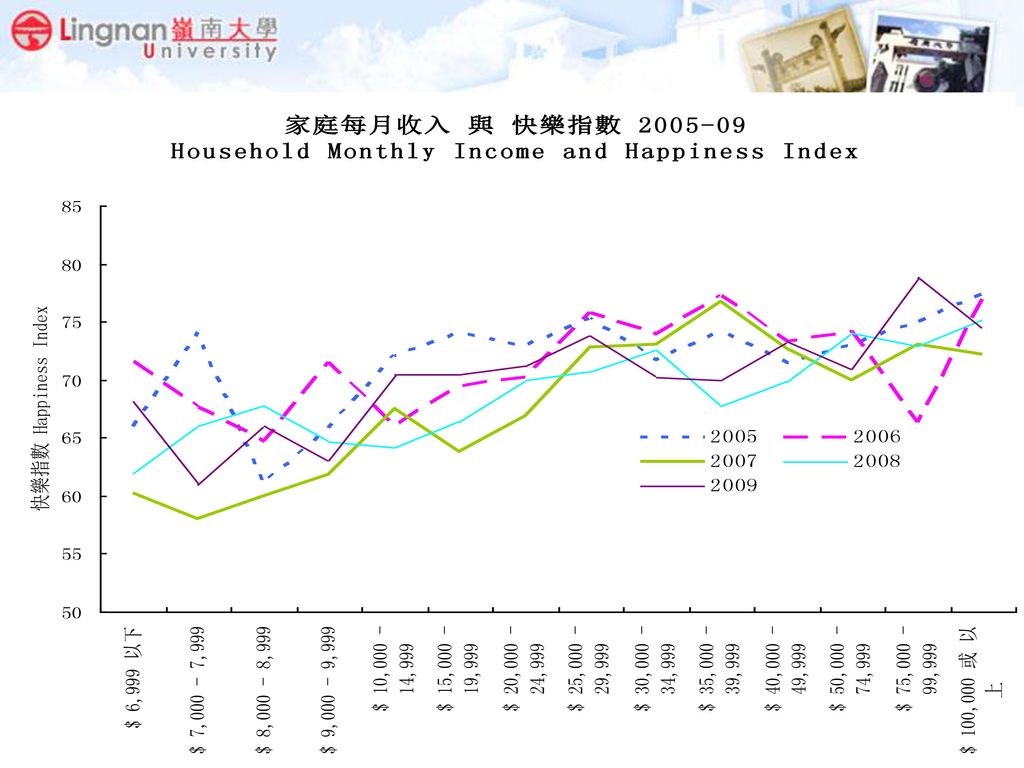
Income, Financial Situation and Happiness 收入, 財政狀況與快樂

10
(包括無收入人士 including no income group)
家庭每月收入 Household Income 2008 2009 09 與 08年百分比(%) 轉變 Change 平均值 Men 樣本 數目 Sample 9999 or below 63.04 102 66.63 104 +5.69% 10,000-19,999 65.10 70.42 119 +8.16% ,999 70.20 101 71.88 106 +2.39% 30,000-39,999 71.64 73 70.13 76 -2.11% 40,000 or above 72.91 165 72.81 142 -0.14%
 轉變 Change. 平均值. Men. 樣本. 數目. Sample or below % 10,000-19, % , % 30,000-39, % 40,000 or above %")
11
(不包括無收入人士 excluding no income group)
家庭每月收入 Household Income 2008 2009 09 與 08年百分比(%) 轉變 Change 平均值 Men 樣本 數目 Sample 9999 or below 66.21 58 63.85 65 -3.56% 10,000-19,999 65.10 104 70.42 119 +8.16% ,999 70.20 101 71.89 106 +2.39% 30,000-39,999 71.64 73 70.13 76 -2.11% 40,000 or above 72.91 165 72.82 142 -0.14%
 轉變 Change. 平均值. Men. 樣本. 數目. Sample or below % 10,000-19, % , % 30,000-39, % 40,000 or above %")
12
Is your financial situation better, worse, or about the same compared with last year?

13
Happiness Index by Change of Financial Situation

14
Happiness by Financial Pressure

16
Work and Happiness 工作與快樂

17
Happiness Index by the most favorite activity

18
Happiness Index by Work Pressure

19
Happiness Index by the Satisfaction about Working Environment

20
Happiness Index by Weekly Working Hours

21
其他因素 Other Factors and Happiness

22
Happiness Index by Education

23
Comparison of Happiness Index:
Have you ever experienced great setback?

24
Comparison of Happiness Index:
Did anyone offer you support when you face a setback?

25
Comparison of Happiness Index:
Have you ever experienced poverty?

26
Comparison of Happiness Index:
“I participated actively in voluntary work in the past year”:

27
Happiness Index by Degree of Religious Practice/faith

28
Happiness Index by Religion

29
三式快樂 Three Happinesses

30
Measures of prospective happiness前瞻快樂
Disagree or agree ( scale of 0 to 10) I meet the future 10 years with excitement and joy 我以興奮的心情迎接未來的十年 I do not usually worry about the future 我對未來並不憂慮 I expect to continue to learn more things in the rest of my life 我期待不斷學習 Measures of happiness in process過程快樂 I enjoy my work/housework.我享受我的工作(包括家務) I enjoy the time with my family.我享受與家人相處的時間 I find much interest in my living. 我從生活中找到很多樂趣 Measures of retrospective happiness後顧快樂 Looking back, I am satisfied with my performance. 回首過去, 我滿意自己的表現 I have grown wiser because I am able to learn from my mistakes. 我從錯誤中學到很多,智慧漸長
 I meet the future 10 years with excitement and joy 我以興奮的心情迎接未來的十年. I do not usually worry about the future 我對未來並不憂慮. I expect to continue to learn more things in the rest of my life. 我期待不斷學習. Measures of happiness in process過程快樂. I enjoy my work/housework.我享受我的工作(包括家務) I enjoy the time with my family.我享受與家人相處的時間. I find much interest in my living. 我從生活中找到很多樂趣. Measures of retrospective happiness後顧快樂. Looking back, I am satisfied with my performance. 回首過去, 我滿意自己的表現. I have grown wiser because I am able to learn from my mistakes. 我從錯誤中學到很多,智慧漸長.")
31
Regression Analysis (迴歸分析)
Dependent Variable: 快樂指數(max=10) 快樂由人生三部份組成:現在, 過去, 未來 Independent Variables: 快樂指數 Coefficient t statistic Constant 2.141 8.222*** 未來組成部份 prospective happiness 0.091 2.582*** 現在組成部份 happiness in process 0.387 9.369*** 過去組成部份 retrospective happiness 0.246 6.11*** ** & *** indicate 5% & 1% statistical significance R bar square: F-statistics: *** 统計上, 那個人生三部份對快樂指數影響較大? 現在組成部份> 過去組成部份> 未來組成部份 For someone with 10 for each of the 3 components, Happiness Index= =9.38
 快樂由人生三部份組成:現在, 過去, 未來. Independent Variables: 快樂指數. Coefficient. t statistic. Constant *** 未來組成部份 prospective happiness *** 現在組成部份 happiness in process *** 過去組成部份 retrospective happiness *** ** & *** indicate 5% & 1% statistical significance R bar square: F-statistics: *** 统計上, 那個人生三部份對快樂指數影響較大 現在組成部份> 過去組成部份> 未來組成部份. For someone with 10 for each of the 3 components, Happiness Index= =9.38.")
32
Dependent Variable: Happiness Index 快樂指數(max=10) 按年齡劃分的廻歸分析 年齡Age
21-29 30-60 60或以上 (60 or above) Constant 1.721 (3.463)*** 1.680 (5.123)*** 4.197 (4.590)*** 未來組成部份 prospective happiness 0.125 (1.544) 0.097 (2.163)** 0.034 (0.368) 現在組成部份 happiness in process 0.439 (5.081)*** 0.419 (8.065)*** 0.274 (2.159)** 過去組成部份 retrospective happiness 0.242 (3.066)*** 0.262 (5.429)*** 0.141 (0.852) R bar square (F-statistics) 0.389 (38.394)*** 0.362 (94.016)*** 0.127 (5.349)*** ** & *** indicate 5% & 1% statistical significance 32
 Constant (3.463)*** (5.123)*** (4.590)*** 未來組成部份 prospective happiness (1.544) (2.163)** (0.368) 現在組成部份 happiness in process (5.081)*** (8.065)*** (2.159)** 過去組成部份 retrospective happiness (3.066)*** (5.429)*** (0.852) R bar square. (F-statistics) (38.394)*** (94.016)*** (5.349)*** ** & *** indicate 5% & 1% statistical significance. 32.")
33
按年齡劃分, 不同快樂組成部分的平均得分(最低0分, 最高10分)
年齡 Age 21-29 30-60 60或以上 (60 or above) 未來組成部分 Prospective happiness 6.2 6.0 現在組成部分 Happiness in process 6.7 7.3 7.4 過去組成部分 Retrospective happiness 6.1 6.6 7.1
 未來組成部分. Prospective happiness 現在組成部分. Happiness in process 過去組成部分. Retrospective happiness")
34
Regression Analysis (迴歸分析) (with female as interactive variable)
Coefficient (t-test) All cases Age: 21-29 Age: 30-59 Age: 60 or above (Constant) 2.18 (8.328)*** 1.66 (3.184)*** 1.686 (5.138)*** 3.895 (4.26)*** Prospective happiness 0.076 (1.389) 0.013 (0.106) 0.068 (0.945) -0.077 (-0.491) Happiness in process 0.349 (5.661)*** 0.623 (4.468)*** 0.382 (4.937)*** -0.244 (-0.926) Retrospective happiness 0.285 (4.87)*** 0.153 (1.347) 0.319 (4.616)*** 0.78 (2.214)** female x prospective happiness 0.028 (0.389) 0.18 (1.117) 0.054 (0.592) 0.064 (0.324) female x happiness in process 0.06 (0.769) -0.293 (-1.744)* 0.07 (0.725) 0.686 (2.224)** female x retrospective happiness -0.074 (-0.988) 0.157 (1.027) -0.108 (-1.217) -0.731 (-2.033)** R bar square F-statistics 0.328 63.48*** 0.391 19.852*** 0.362 47.441*** 0.147 3.578***
 All cases. Age: Age: Age: 60 or above. (Constant) (8.328)*** (3.184)*** (5.138)*** (4.26)*** Prospective happiness (1.389) (0.106) (0.945) (-0.491) Happiness in process (5.661)*** (4.468)*** (4.937)*** (-0.926) Retrospective happiness (4.87)*** (1.347) (4.616)*** (2.214)** female x prospective happiness (0.389) (1.117) (0.592) (0.324) female x happiness in process (0.769) (-1.744)* (0.725) (2.224)** female x retrospective happiness (-0.988) (1.027) (-1.217) (-2.033)** R bar square. F-statistics *** *** *** ***")
35
Regression Analysis (迴歸分析) (with tertiary education as interactive variable)
Coefficients (t-test) All cases Age: 21-29 Age: 30-59 Age: 60 or above (Constant) 2.106 (8.032)*** 1.818 (3.619)*** 1.562 (4.746)*** 4.056 (4.419)*** Prospective happiness 0.105 (2.534)** 0.164 (1.174) 0.145 (2.838)*** -0.01 (-0.099) Happiness in process 0.372 (7.795)*** 0.337 (2.3)** 0.416 (7.257)*** 0.223 (1.679)* Retrospective happiness 0.262 (5.586)*** 0.308 (2.661)*** 0.246 (4.49)*** 0.275 (1.592) tertiary x prospective happiness -0.039 (-0.503) -0.068 (-0.4) -0.179 (-1.671)* 0.207 (0.815) tertiary x happiness in process 0.028 (0.317) 0.129 (0.745) 0.01 (0.081) 0.485 (1.176) tertiary x retrospective happiness -0.016 (-0.197) -0.086 (-0.565) 0.131 (1.287) -0.783 (-2.003)** R bar square F-statistics 0.332 63.573*** 0.384 18.976*** 0.371 48.884*** 0.161 3.845***
 All cases. Age: Age: Age: 60 or above. (Constant) (8.032)*** (3.619)*** (4.746)*** (4.419)*** Prospective happiness (2.534)** (1.174) (2.838)*** (-0.099) Happiness in process (7.795)*** (2.3)** (7.257)*** (1.679)* Retrospective happiness (5.586)*** (2.661)*** (4.49)*** (1.592) tertiary x prospective happiness (-0.503) (-0.4) (-1.671)* (0.815) tertiary x happiness in process (0.317) (0.745) (0.081) (1.176) tertiary x retrospective happiness (-0.197) (-0.565) (1.287) (-2.003)** R bar square. F-statistics *** *** *** ***")
36
Happiness Formula 快樂方程式 :
= L I F E L = LOVE 關愛 I = INSIGHT 智慧 F = FORTITUDE 堅毅 E = ENGAGEMENT 活動

37
Measures of Love 關愛 Disagree or agree ( scale of 0 to 10) I very much care for my family 我十分關心我的家人 I very much care about social justice 我關心社會公義能否彰顯 Measures of Insight 智慧 Success does not mean outperforming others. 成功不是比別人優勝 Success means achieving the best I can, even though the outcome may not impress. 能盡己所能做到最好, 即便表現一般, 亦屬成功 As long as I have acted according to my conscience, I do not worry about how others regard me. 只要光明磊落, 就不用理會別人如何評價自己 I am comfortable with myself and will not be troubled by my inadequacies. 我接受我自己,不會因自己的不足而煩惱 Making money is not my favorite activity. (Yes=9; Making money is the most favorite=4) 賺錢不是我喜愛的活動
 賺錢不是我喜愛的活動.")
38
Measures of fortitude 堅毅
Disagree or agree ( scale of 0 to 10) My faith and belief give me support when I experience hardship. 我的信念或信仰會在我遇上挫折時, 給我支持 Measures of engagement 活動 I strive for opportunities to learn and develop my potential. 我爭取機會學習盡量發揮所長 I have clearly identified goals and purposes in life. 我有清晰的人生目標
 My faith and belief give me support when I experience hardship. 我的信念或信仰會在我遇上挫折時, 給我支持. Measures of engagement 活動. I strive for opportunities to learn and develop my potential. 我爭取機會學習盡量發揮所長. I have clearly identified goals and purposes in life. 我有清晰的人生目標.")
39
2008 Survey Measures of Love 關愛 Disagree or agree ( scale of 0 to 10)
I very much care for my family 我十分關心我的家人 I very much care about social justice 我關心社會公義能否彰顯 My family very much cares for me 我的家人十分關心我 Measures of Insight 智慧 I am not worried about falling behind others 我不會理會別人是否比我優勝 I do not care about how others treat me 我不會理會別人如何待我 I do not care about how others think of me 我不會理會別人如何評價我 I am comfortable with myself and will not be troubled by my inadequacies. 我接受我自己,不會因自己的不足而煩惱 I feel fine as long as I have met my essential needs.我不愛與人家比較,我深信知足常樂

40
2008 Survey Measures of fortitude 堅毅
Disagree or agree ( scale of 0 to 10) Failures only strengthen me 挫折使我變得更堅強 I have clear and strong convictions 我有清晰牢固的信念或信仰 Measures of engagement 活動 I have ample opportunity and am taking these opportunities to develop my potential 我有足夠機會並能充份發揮所長 I have clearly identified goals and purposes in life. 我有清晰的人生目標
 Failures only strengthen me. 挫折使我變得更堅強. I have clear and strong convictions 我有清晰牢固的信念或信仰. Measures of engagement 活動. I have ample opportunity and am taking these opportunities to develop my potential. 我有足夠機會並能充份發揮所長. I have clearly identified goals and purposes in life. 我有清晰的人生目標.")
41
Regression Analysis (迴歸分析)
Dependent Variable: 快樂指數(maximum 10) Independent Variables Coefficient t statistic Constant 1.262 2.579*** 關愛原素 Love (0-10) 0.092 2.122** 智慧原素 Insight (0-10) 0.391 5.553*** 堅毅原素 Fortitude(0-10) 0.09 3.895*** 活動原素 Engagement(0-10) 0.252 7.387*** For 10 marks of each component, Happiness Index = =9.51 R bar square: 0.255 F statistics: *** ** & *** indicate 5% and 1% statistical significance respectively
 Independent Variables. Coefficient. t statistic. Constant *** 關愛原素 Love (0-10) ** 智慧原素 Insight (0-10) *** 堅毅原素 Fortitude(0-10) *** 活動原素 Engagement(0-10) *** For 10 marks of each component, Happiness Index = =9.51. R bar square: F statistics: *** ** & *** indicate 5% and 1% statistical significance respectively.")
42
Regression Analysis (迴歸分析): (with tertiary education as interactive variable)
Dependent Variable: 快樂指數 Coefficients t Prob. value (Constant) 1.265 2.567 0.011 關愛元素 love (0-10) 0.116 2.11** 0.035 智慧元素 wisdom (0-10) 0.443 5.847*** 堅毅元素 fortitude (0-10) 0.065 2.46** 0.014 活動元素 engagement (0-10) 0.202 5.087*** Tertiary education x love -0.097 -1.117 0.264 Tertiary education x wisdom -0.213 -2.077** 0.038 Tertiary education x fortitude 0.113 2.118** Tertiary education x engagement 0.182 2.345** 0.019 R-Bar Square: 0.272 F statistics: ***
 關愛元素 love (0-10) ** 智慧元素 wisdom (0-10) *** 堅毅元素 fortitude (0-10) ** 活動元素 engagement (0-10) *** Tertiary education x love Tertiary education x wisdom ** Tertiary education x fortitude ** Tertiary education x engagement ** R-Bar Square: F statistics: ***")
43
Regression Analysis (迴歸分析): (with age as interactive variable)
Dependent Variable: 快樂指數 Coefficients t Prob. value (Constant) 0.944* 1.87 0.062 關愛元素 love (0-10) 0.173*** 2.859 0.004 智慧元素 wisdom (0-10) 0.315*** 3.877 堅毅元素 fortitude (0-10) 0.093*** 3.356 0.001 活動元素 engagement (0-10) 0.274*** 5.991 21-29 x love -0.248*** -2.61 0.009 21-29 x wisdom 0.135 1.174 0.241 21-29 x fortitude 0.01 0.171 0.864 21-29 x engagement 0.131 1.349 0.178 Above 60x love -0.106 -0.817 0.414 Above 60x wisdom (wisdom matters most when old) 0.34** 2.262** 0.024 Above 60 x fortitude -0.066 -0.935 0.35 Above 60 x engagement -0.138* -1.686* 0.092 R-Bar Square: F statistic: 19.96*** =9.494; love matters most for prime age people; wisdom matters most for the old; young people do not care about love as much as other age groups
 0.944* 關愛元素 love (0-10) 0.173*** 智慧元素 wisdom (0-10) 0.315*** 堅毅元素 fortitude (0-10) 0.093*** 活動元素 engagement (0-10) 0.274*** x love *** x wisdom x fortitude x engagement Above 60x love Above 60x wisdom (wisdom matters most when old) 0.34** 2.262** Above 60 x fortitude Above 60 x engagement * * R-Bar Square: F statistic: 19.96*** =9.494; love matters most for prime age people; wisdom matters most for the old; young people do not care about love as much as other age groups.")
44
不同年齡組別在快樂方程式元素的得分比較, 2009 (2008數字)
Scores in different happiness formula elements across age, 2009 (2008 figure) 不同年齡組別在快樂方程式元素的得分比較, 2009 (2008數字) 年齡Age 21-29 30-59 60或以上 60 or above 全部樣本 Total Mean N 關愛元素love 7.02 7.00 181 7.79 7.80 512 8.24 7.84 102 7.67 7.64 795 智慧元素wisdom 6.88 5.26 175 7.14 6.11 460 7.31 6.53 93 7.10 5.98 728 堅毅元素fortitude 6.63 6.38 152 6.86 449 7.54 7.37 82 6.89 6.99 683 活動元素engagement 6.84 6.19 180 6.43 516 6.23 5.73 99 6.76 6.29
 不同年齡組別在快樂方程式元素的得分比較, 2009 (2008數字) 年齡Age 或以上. 60 or above. 全部樣本. Total. Mean. N. 關愛元素love 智慧元素wisdom 堅毅元素fortitude 活動元素engagement")
45
不同性別在快樂方程式元素的得分比較, 2009 (2008數字)
Scores in different happiness formula elements across sex, 2009 (2008 figure) 不同性別在快樂方程式元素的得分比較, 2009 (2008數字) 性別Sex 男 Male 女 Female 全部樣本 Total Mean N 關愛元素 love 7.45 7.40 331 7.81 7.80 475 7.67 7.63 806 智慧元素wisdom 6.99 5.84 311 7.18 6.07 426 7.10 5.97 737 堅毅元素fortitude 6.53 6.67 278 7.14 7.21 415 6.89 6.98 693 活動元素engagement 6.15 6.81 6.39 476 6.75 6.29 807
 不同性別在快樂方程式元素的得分比較, 2009 (2008數字) 性別Sex. 男 Male. 女 Female. 全部樣本 Total. Mean. N. 關愛元素. love 智慧元素wisdom 堅毅元素fortitude 活動元素engagement")
46
Regression Analysis (迴歸分析): with control variables
Dependent Variable: 快樂指數 Coefficients t Prob. Value (Constant) 0.971 1.623 0.105 關愛元素 love 0.089 1.72* 0.086 智慧元素 wisdom 0.411 5.095*** 堅毅元素 fortitude 0.088 3.304*** 0.001 活動元素 engagement 0.283 6.826*** 已婚 married (1 or 0) 0.053 0.29 0.772 收入低於一萬元 income lower than (1 or 0) -0.402 -2.075** 0.039 大學教育 tertiary education (1 or 0) -0.156 -1.046 0.296 年齡(21-29歲) Young Age (1 or 0) 0.04 0.185 0.853 年齡(60歲或以上) Old Age (1 or 0) 0.616 2.476** 0.014 R-Bar Square: 0.318 F Statistic: ***
 關愛元素 love * 智慧元素 wisdom *** 堅毅元素 fortitude *** 活動元素 engagement *** 已婚 married (1 or 0) 收入低於一萬元 income lower than (1 or 0) ** 大學教育 tertiary education (1 or 0) 年齡(21-29歲) Young Age (1 or 0) 年齡(60歲或以上) Old Age (1 or 0) ** R-Bar Square: F Statistic: ***")
47
Scores in different happiness formula elements across education, 2009
不同教育程度在快樂方程式元素的得分比較, 2009 (2008數字) 教育程度Education 全部樣本 All 小學或以下 Primary or below 中學 Secondary 大專或以上 Tertiary or above mean N Mean 關愛元素love 7.68 7.62 791 7.83 7.43 115 7.80 7.69 407 7.44 7.60 269 智慧元素wisdom 7.09 5.97 724 7.17 6.35 99 7.11 6.15 373 7.05 5.60 252 堅毅元素fortitude 6.89 6.97 680 6.61 6.60 95 6.70 6.96 336 7.24 7.13 249 活動元素engagement 6.77 6.27 792 5.30 114 6.75 6.18 408 7.04 6.73 270
 教育程度Education. 全部樣本. All. 小學或以下. Primary or below. 中學. Secondary. 大專或以上. Tertiary or above. mean. N. Mean. 關愛元素love 智慧元素wisdom 堅毅元素fortitude 活動元素engagement")
48
不快樂人士分析 (快樂指數在0-4分屬不快樂人士)
")
49
Comparison between Unhappy and All Respondents by Age
比較不快樂的人與整體受訪者的年齡 Comparison between Unhappy and All Respondents by Age (bracket % refer to last year) 年齡 Age 不快樂的人(N) Unhappy Respondents 整體受訪者(N) All Respondents 不快樂佔百分比 % of Unhappy Respondents 21-29 11 181 6.1%(9.6%) 30-49 22 346 6.4%(7.9%) 50或以上 (50 or above) 19 281 6.8%(9.2%) 總數Total 52 808 6.4%(8.6%)
 年齡. Age. 不快樂的人(N) Unhappy Respondents. 整體受訪者(N) All Respondents. 不快樂佔百分比. % of Unhappy Respondents %(9.6%) %(7.9%) 50或以上. (50 or above) %(9.2%) 總數Total %(8.6%)")
50
Comparison between Unhappy and All Respondents by Personal Income 個人收入
比較不快樂的人與整體受訪者的個人收入 Comparison between Unhappy and All Respondents by Personal Income 個人收入 Personal Income 不快樂的人(N) Unhappy Respondents 整體受訪者(N) All Respondents 不快樂佔百分比 % of Unhappy Respondents $9999或以下 27 382 7.1% $ $19999 5 161 3.1% $ $39999 109 4.6% $40000或以上 1 43 2.3% 總數Total 38 695 5.5% 比較不快樂的人與整體受訪者的家庭收入 Comparison between Unhappy and All Respondents by Household Income 家庭收入 Household Income 不快樂的人(N) Unhappy Respondents 整體受訪者(N) All Respondents 不快樂佔百分比 % of Unhappy Respondents $9999或以下 9 104 8.7% $ $19999 10 119 8.4% $ $39999 11 182 6.0% $40000或以上 2 142 1.4% 總數Total 32 547 5.9%
 Unhappy Respondents. 整體受訪者(N) All Respondents. 不快樂佔百分比. % of Unhappy Respondents. $9999或以下 % $ $ % $ $ % $40000或以上 % 總數Total % 比較不快樂的人與整體受訪者的家庭收入. Comparison between Unhappy and All Respondents by Household Income. 家庭收入. Household Income. 不快樂的人(N) Unhappy Respondents. 整體受訪者(N) All Respondents. 不快樂佔百分比. % of Unhappy Respondents. $9999或以下 % $ $ % $ $ % $40000或以上 % 總數Total %")
51
2008 Survey 比較不快樂的人與整體受訪者的個人收入
Comparison between Unhappy and All Respondents by Personal Income 個人收入 Personal Income 不快樂的人(N) Unhappy Respondents 整體受訪者(N) All Respondents 不快樂佔百分比 % of Unhappy Respondents $9999或以下 33 363 9.1% $ $19999 17 180 9.4% $ $39999 4 112 3.6% $40000或以上 7 55 12.7% 總數Total 61 710 8.6% 比較不快樂的人與整體受訪者的家庭收入 Comparison between Unhappy and All Respondents by Household Income 家庭收入 Household Income 不快樂的人(N) Unhappy Respondents 整體受訪者(N) All Respondents 不快樂佔百分比 % of Unhappy Respondents $9999或以下 14 103 13.6% $ $19999 13 104 12.5% $ $39999 9 175 5.1% $40000或以上 165 7.9% 總數Total 49 547 9.0%
 Unhappy Respondents. 整體受訪者(N) All Respondents. 不快樂佔百分比. % of Unhappy Respondents. $9999或以下 % $ $ % $ $ % $40000或以上 % 總數Total % 比較不快樂的人與整體受訪者的家庭收入. Comparison between Unhappy and All Respondents by Household Income. 家庭收入. Household Income. 不快樂的人(N) Unhappy Respondents. 整體受訪者(N) All Respondents. 不快樂佔百分比. % of Unhappy Respondents. $9999或以下 % $ $ % $ $ % $40000或以上 % 總數Total %")
52
Comparison between Unhappy and All Respondents by Occupation 職位
比較不快樂的人與整體受訪者的職位 Comparison between Unhappy and All Respondents by Occupation 職位 Occupation 不快樂的人(N) Unhappy Respondents 整體受訪者(N) All Respondents 不快樂佔百分比 % of Unhappy Respondents 經理及行政人員 Managers & Administrators 3 80 3.8% 專業人員 Professionals 6 129 4.7% 文員 Clerks 7 87 8.0% 服務工作及商店銷售人員 Ser & Shop Sales Workers 4 69 5.8% 非技術工人 Elementary Occupation 52 7.7% 家庭主婦 Housewives 141 5.0% 失業、待業 Unemployed 8 50 1.6% 退休 Retired 96 7.3% 總數Total 46 594
 Unhappy Respondents. 整體受訪者(N) All Respondents. 不快樂佔百分比. % of Unhappy Respondents. 經理及行政人員. Managers & Administrators % 專業人員 Professionals % 文員 Clerks % 服務工作及商店銷售人員. Ser & Shop Sales Workers % 非技術工人. Elementary Occupation % 家庭主婦 Housewives % 失業、待業 Unemployed % 退休 Retired % 總數Total")
Similar presentations


正确 2 )多词 3 )缺词 4 )错词 删除 补漏 更正 “1126” 原则 “1225” 原则 “1117” 原则.>")
 如无错误,在该行右边横线上画一个 ( );如有错误(每行只有一个错误), 则按下列情况改正:>")


 Revised By: Henry 以下是一些能帶給你一個美麗人生的秘訣 中文註解:>")


 1 版. 1. What types of bullying do you know about? Physical hitting, tripping, stealing and hair pulling Social telling other kids.>")


