Download presentation
Presentation is loading. Please wait.

1
Ch6. Mechanical Properties of Metals

2
6.1 簡介 各種材料在製造或使用期間,會受到外力的作用而產生固有的反應。 力負荷大小 小 大 變 形 (deformation)
6.1 簡介 各種材料在製造或使用期間,會受到外力的作用而產生固有的反應。 力負荷大小 小 大 變 形 (deformation) (elastic) (plastic) (fracture) 朔性變形 彈性變形 斷裂
 (elastic) (plastic) (fracture) 朔性變形. 彈性變形. 斷裂.")
3
6.2 應力和應變的觀念 (Concepts of Stress and Strain)
拉伸試驗(Tension Tests) 壓縮測試(Compression Tests) 剪切和扭轉測試(Shear and Torsional Tests)
 壓縮測試(Compression Tests) 剪切和扭轉測試(Shear and Torsional Tests)")
4
拉伸試驗 若一靜態的(或相對於時間變化緩慢的)負荷 被均勻地施加於一元件的表面或橫截面時,
其機械行為可藉由應力-應變測試來了解。如圖6.1所示:

5
拉伸試驗(Tension Tests) Figure 6.1(a)拉伸負荷如何產生一伸長且正線性應變概略說明圖。
虛線代表變形前的形,實現代表變形後之形狀

6
拉伸試驗 工程應力: 工程應變: F:垂直於試片橫截面瞬間所施加的負荷 A0:原來橫截面面積 l:瞬間長度 l0:施加負重之前試片原來的長度

7
拉伸試驗 Figure6.2 標準的拉伸試片。 橫截面通常是圓的,但有時亦使用方形試片。

8
Figure6.3 用來進行拉伸應力-應變測試儀器之示圖。試片被移動的夾頭拉長;荷重單元和伸長計分別量測施加應力和伸長量的大小。

9
壓縮測試 若工作中的力是壓縮力,則可引導進行壓縮應力-應變測試, 除了作用力是壓縮力和試片沿應力方向收縮外,
壓縮試驗的進行方式類似拉伸試驗。

10
壓縮測試(Compression Tests)
Figure 6.1(b) 一壓縮負荷如何產生壓縮何-負線性應變的概略說明圖。
 一壓縮負荷如何產生壓縮何-負線性應變的概略說明圖。")
11
剪切和扭轉測試 如圖6.1(c)中使用純剪力進行測試時,剪應力的計算是根據下式而得的 F:荷重或平行於上以及下平面之施力
A:上以及下平面之面積 γ:應變角θ的正切,如圖中所表示

12
剪切測試(Shear Tests) Figure 6.1(c)剪應變γ的概略代表圖,其中γ=tanθ。
 Figure 6.1(c)剪應變γ的概略代表圖,其中γ=tanθ。")
13
扭轉測試( Torsional Tests)
Figure 6.1(d)由施加扭矩T所產生的扭轉變形(即扭轉角度ψ)的概略示意圖。
由施加扭矩T所產生的扭轉變形(即扭轉角度ψ)的概略示意圖。")
14
Stress State on The Plane with

15
6.3~6.5 彈性變形 (Elastic Deformation)
虎克定律(Hook’s Law) :應力和應變的正比關係如下 比例常數E: 稱為彈性模數(modulus of elastic) 或稱為揚氏係數(Young’s modulus) 。
 :應力和應變的正比關係如下. 比例常數E: 稱為彈性模數(modulus of elastic) 或稱為揚氏係數(Young’s modulus) 。")
16
彈性變形(Elastic Deformation)
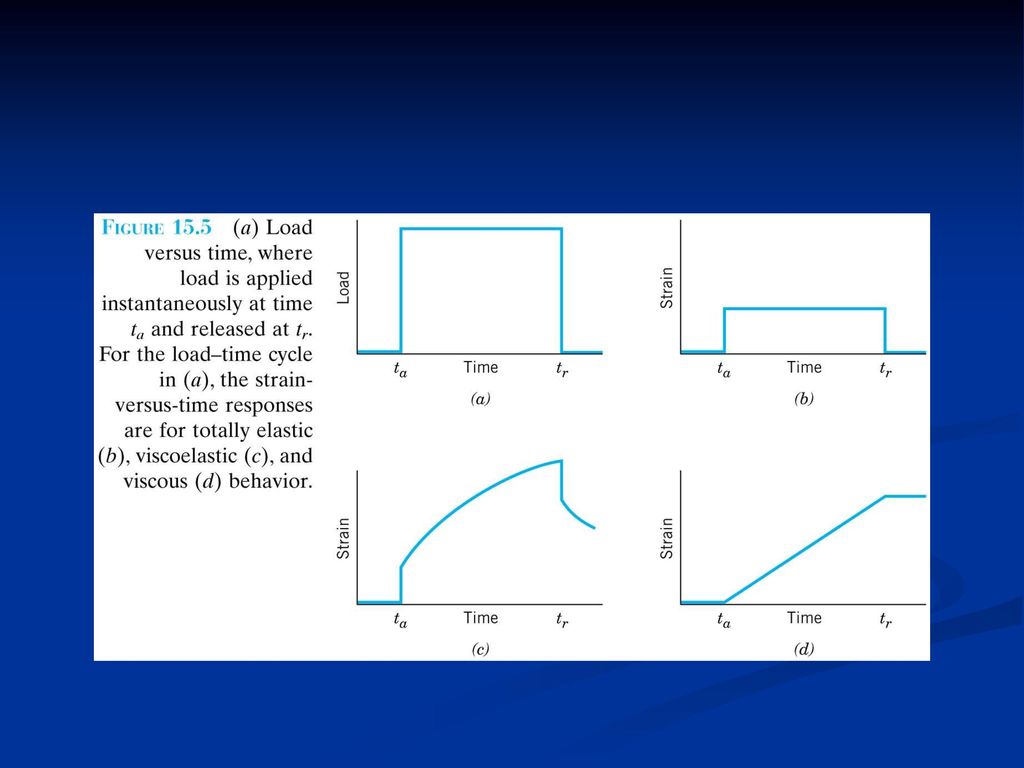
Figure 6.5 顯示施加荷重和釋放荷重循環的線彈性變形之應力-應變圖。

17
各種金屬合金於室溫下之彈性和剪模數以及蒲松比

18
6.3 應力-應變行為 Figure 6.5 顯示非線性該行為的概要應力-應變圖,且顯示如何決定割線和正切模數。

19
*對於弱鍵結原子與與強鍵結原子而言,作用力對原子間分開距離之作圖,
*彈性模數的大小正比於每一取現在平衡原子間 分開距離r0的斜率。

20
溫度對彈性係數之影響 Figure 6.8 Plot of modulus elasticity versus temperature for Tungsten, Steel, and Aluminum.

22
6.5 材料的彈性性質 (Elastic Properties of Materials)
Figure 6.9 施加拉升應力使軸向(z)伸長(正應變)和橫向(x和y)收縮(負應變) 。 施加應力前的尺寸以實線代表,之後則以虛線代表
伸長(正應變)和橫向(x和y)收縮(負應變) 。 施加應力前的尺寸以實線代表,之後則以虛線代表.")
23
蒲松比 (Poisson’s ratio) 當試片在軸向(假數為x方向)受拉力時,在x軸上會伸長,同時在橫軸(y、z方向)產生收縮。
ν 0<ν<1 均相性 (isotropic) ν≒0.25 一般金屬 ν≒0.33
 ν≒0.25. 一般金屬. ν≒0.33.")
24
6.6~6.10 塑性變形 (Plastic Deformation)
Fig 6.10 (a)顯示出彈性和塑性變形金屬的典型應力-應變行為,比例限P降伏強度σx σy由0.002應變偏位方法來決定 (b)對某些顯示出降伏點現象鋼的應力-應變行為。
顯示出彈性和塑性變形金屬的典型應力-應變行為,比例限P降伏強度σx σy由0.002應變偏位方法來決定. (b)對某些顯示出降伏點現象鋼的應力-應變行為。")
25
6.6 拉伸性質 (Tensile Properties)
降伏和降伏強度(Yielding and Yield Strength) 拉伸強度(Tensile Strength) 延性(Ductility) 彈性能(Resilience) 韌性(Toughness)
 拉伸強度(Tensile Strength) 延性(Ductility) 彈性能(Resilience) 韌性(Toughness)")
26
典型之工程應力-應變特性圖 Fig 6.11 典型的工程應力-應變至破裂點F的行為,拉伸強度TS於點M。
圓圈內的插圖代表曲線於各種不同點時變形試片的幾何形狀。

27
Example 6.3 Figure 6.12 討論例題6.3黃銅試片-應力應變的行為。

28
延性 (Ductility) Figure 6.13 負荷到斷裂之脆性和延性材料之拉伸應力-應變行為圖。
 Figure 6.13 負荷到斷裂之脆性和延性材料之拉伸應力-應變行為圖。")
29
延性定量的表示 伸長量百分比(percent elongation) 面積收縮百分比(percent area reduction)
lf:破裂時的長度 l0:原標距長度 %AR:面積收縮率百比分 Af:斷裂點 A0:原橫截面積

30
延性(%EL)是標距(l.)之函數
是標距(l.)之函數")
32
Fig.2.3 拉伸試驗的 總伸長量隨 拉伸試片之 標距長而改變

33
彈性能 (Resilience) 當材料彈性變形時材料吸收能量的能力,除去負荷則此能量回復。
彈性能模數(modulus of resilience) εy:降伏點之應變
 εy:降伏點之應變.")
34
假設線彈性區域 代入前述之虎克定律:

35
Figure 6.15 由一材料的拉伸應力-應變行為如何,來決定彈性能模數(相當於陰影的面積) 。
 。")
36
退火狀態下金屬和合金的機械性質

37
鐵在三種溫度下工程應力-應變之行為

38
6.7真應力與真應變 (true stress-strain)
真應變(true strain) F:垂直於試片橫截面瞬間所施加的負荷 Ai:瞬間橫截面面積 li:瞬間長度 l0:施加負重之前試片原來的長度
 F:垂直於試片橫截面瞬間所施加的負荷. Ai:瞬間橫截面面積. li:瞬間長度. l0:施加負重之前試片原來的長度.")
39
若變形期間體積不變則 真實與工程應力-應變的關係:

40
Figure 6.16 A comparison of typical tensile of engineering strength-strain and true strength-strain. Necking began at point M on the engineering curve, which corresponds to M′ on the true curve. The “ corrected “ true strength-strain takes into account the complex stress state within the neck region.

41
Fig.2.6 (a)頸縮區域 (b)作用於 頸縮區之 單元的應力
頸縮區域 (b)作用於 頸縮區之 單元的應力")
42
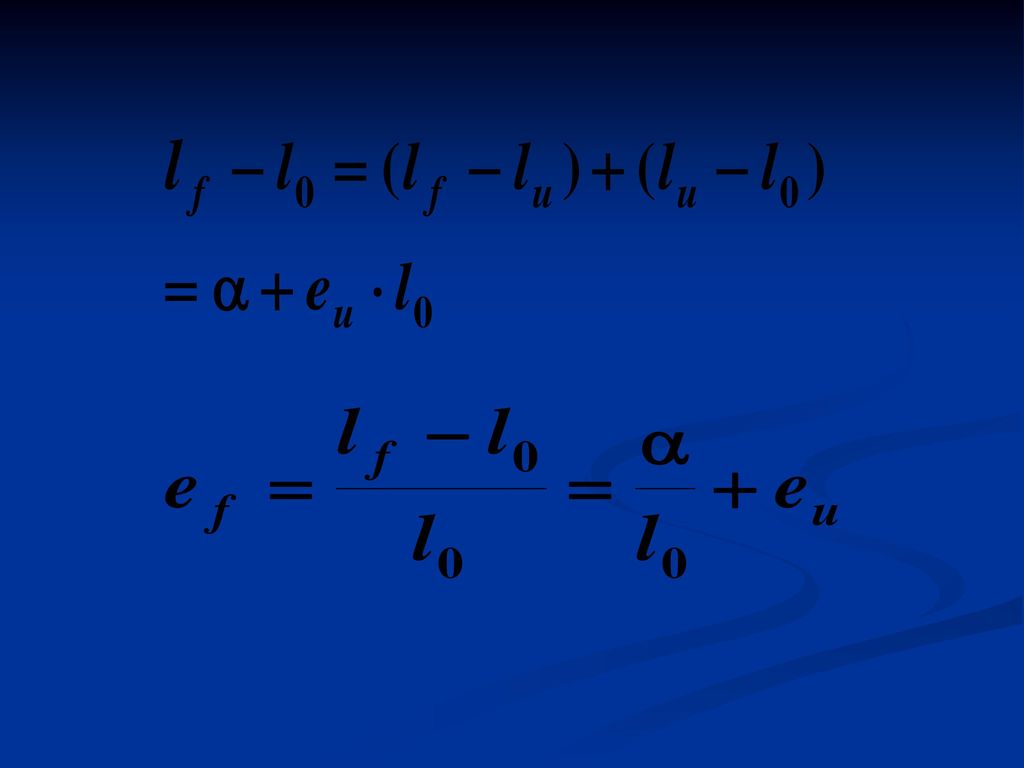
﹝例 2.5﹞ 證明應變硬化指數 (n) 等於均勻變形 的真應變 (εu)
 等於均勻變形 的真應變 (εu)")
44
6.8 Elastic Recovery After Plastic Def.
Figure 6.17 Schematic tensile stress-strain diagram showing the phenomena of elastic strain recovery and strain hardening。 The initial yield strength is designed as σy0;σy1 is the yield strength after releasing the load at point D, and upon the reloading

45
6.9 壓縮、剪力和扭轉變形 (Compressive, Shear, and Torsional Deformation)
")
46
6.10 硬度(Hardness) 硬度:材料抵抗朔性變形之能力 硬度試驗之種類: 1. 壓痕硬度 2.劃痕硬度 3.反跳硬度 4.車削硬度
1. 壓痕硬度 2.劃痕硬度 3.反跳硬度 4.車削硬度 洛氏硬度測試(Rockwell Hardness Tests) 諾普和維克氏微硬度測試 (Knoop and Vicks Microhardness Tests) 硬度轉換(hardness conversion)
 諾普和維克氏微硬度測試. (Knoop and Vicks Microhardness Tests) 硬度轉換(hardness conversion)")
47
(壓痕)硬度測試技術
硬度測試技術")
48
洛氏硬度尺度

49
表面洛氏硬度尺度

50
Figure 6.18 Comparison of several hardness scales

51
硬度和拉伸強度間的關係 (Correlation Between Hardness and Tensile Strength)
Figure 6.19 Relationship between hardness and tensile strength for steel, brass, and cast iron

52
Table 2.8 Mohs 硬度尺

53
圖2.14

54
6.11 Property Variability n:number of observation
xi:value of a discrete measurement x:average s:the standard deviation

55
Example 6.6

56
6.12 Design & Safety Factors
σd:design stress σc:calculated stress level N′:design factor σw:safe stress N:safety factor

57
CASE STUDY 6.13 Materials Selection for a Torsionally Stressed Shaft

58
Strength L:length r:shaft radius ψ:twist angle Mt:twisting moment
Figure 6.21 A solid cylindrical shaft that experiences an angle of twist ψ in response to the application of a twisting moment Mr.

59
J:polar moment of inertial
τ:shear stress τf:shear strength

60
ρ: density πr 2L:cylinder volume L:length τf:shear strength

61
Parameters of right-hand side are grouped into three sets of parentheses.
P:performance index

62
Figure 6.22 Strength versus density materials selection chart.
Design guidelines for performance indices of 3,10,30 and 100 (MPa)2/3 m3/Mg have been constructed, all having a slope of 2/3.
2/3 m3/Mg have been constructed, all having a slope of 2/3.")
63
Figure 6.23 Strength versus density materials selection chart.
Those materials lying within the shaded region are acceptable candidates foe a solid cylindrical shaft that has a mass-strength performance index in excess of 10 (MPa)2/3 m3/Mg, and a strength of at least 300 MPa (43,500 psi)
2/3 m3/Mg, and a strength of at least 300 MPa (43,500 psi)")
64
Five materials ranked according to strength performance

65
Considering the cost of these five remaining candidate materials

66
Questions 6.4, 6.7, 6.9, 6.22, , 6.36, 6.37 6.41, 6.44, 6.49, 6.51 6.D6

Similar presentations


 (6) 2017年3月7日 返回总目录.>")


杆内的应力>")


材料不可影響宿主 (2)宿主不可影響材料 骨科生醫材料設計的兩個重要的關係︰ (1)材料不可影響宿主>")
 可用來量測拉伸試驗中試桿之正向應變,其係由金屬線格子或金屬箔黏貼在試桿上而構成。對於物體上一般負載,在其自由表面上某點之正向應變通常利用一組具三個電阻應變規,安置在一特定模式下而定出。此模式稱之為應變菊花座.>")


>")

