Download presentation
Presentation is loading. Please wait.

1
氣候變遷與社經發展情境之分析與評估:氣候變遷
11-1 許 晃 雄 中央研究院環境變遷研究中心研究員 臺大新百家學堂 時間:2011年 11月 30日(星期三)下午 15:30 – 17:20 地點:臺大博雅館101室 氣候變遷與社經發展情境之分析與評估:氣候變遷 【本著作除另有著明外,採取創用CC「姓名標示—非商業性— 相同方式分享」臺灣3.0版授權釋出】
下午 15:30 – 17:20. 地點:臺大博雅館101室. 氣候變遷與社經發展情境之分析與評估:氣候變遷. 【本著作除另有著明外,採取創用CC「姓名標示—非商業性— 相同方式分享」臺灣3.0版授權釋出】")
2
全球平均溫度上升速率越來越快 ? 2 IPCC AR4

3
人類的影響?還是自然的變化? 「回到過去」的虛擬實境模擬 模式架構:大氣、海洋、陸地、植被… 溫室氣體 懸浮微粒 火山灰 太陽輻射

4
日本的「地球模擬器」 (Earth Simulator)
")
5
模擬 觀測 溫室氣體 太陽輻射 臭氧 火山 硫酸鹽微粒 This figure shows the level of agreement between a climate model driven by five factors and the historical temperature record. The negative component identified as "sulfate" is associated with the aerosol emissions blamed for global dimming.

6
IPCC(2007)報告:過去半世紀的全球暖化,
全球與陸塊溫度變遷的「虛擬實境」模擬 IPCC(2007)報告:過去半世紀的全球暖化, 極可能是人造溫室氣體增加造成的! FIGURE SPM-4. Comparison of observed continental- and global-scale changes in surface temperature with results simulated by climate models using natural and anthropogenic forcings. Decadal averages of observations are shown for the period 1906–2005 (black line) plotted against the centre of the decade and relative to the corresponding average for 1901–1950. Lines are dashed where spatial coverage is less than 50%. Blue shaded bands show the 5–95% range for 19 simulations from 5 climate models using only the natural forcings due to solar activity and volcanoes. Red shaded bands show the 5–95% range for 58 simulations from 14 climate models using both natural and anthropogenic forcings. {FAQ 9.2, Figure 1} 6 IPCC AR4
報告:過去半世紀的全球暖化, 極可能是人造溫室氣體增加造成的! FIGURE SPM-4. Comparison of observed continental- and global-scale changes in surface temperature. with results simulated by climate models using natural and anthropogenic forcings. Decadal averages of. observations are shown for the period 1906–2005 (black line) plotted against the centre of the decade and. relative to the corresponding average for 1901–1950. Lines are dashed where spatial coverage is less than. 50%. Blue shaded bands show the 5–95% range for 19 simulations from 5 climate models using only the. natural forcings due to solar activity and volcanoes. Red shaded bands show the 5–95% range for 58. simulations from 14 climate models using both natural and anthropogenic forcings. {FAQ 9.2, Figure 1} 6. IPCC AR4.")
7
IPCC TAR

8
全球平均氣溫未來變遷的情境推估 6.4 4.0 1.8 1.1 IPCC AR4 8
Figure SPM-7. Solid lines are multi-model global averages of surface warming (relative to ) for the scenarios A2, A1B and B1, shown as continuations of the 20th century simulations. Shading denotes the plus/minus one standard deviation range of individual model annual means. The number of AOGCMs run for a given time period and scenario is indicated by the coloured numbers at the bottom part of the panel. The orange line is for the experiment where concentrations were held constant at year 2000 values. The gray bars at right indicate the best estimate (solid line within each bar) and the likely range assessed for the six SRES marker scenarios. The assessment of the best estimate and likely ranges in the gray bars includes the AOGCMs in the left part of the figure, as well as results from a hierarchy of independent models and observational constraints (Figs and 10.29) IPCC AR4 8
 for the. scenarios A2, A1B and B1, shown as continuations of the 20th century simulations. Shading denotes the plus/minus. one standard deviation range of individual model annual means. The number of AOGCMs run for a given time. period and scenario is indicated by the coloured numbers at the bottom part of the panel. The orange line is for the. experiment where concentrations were held constant at year 2000 values. The gray bars at right indicate the best. estimate (solid line within each bar) and the likely range assessed for the six SRES marker scenarios. The. assessment of the best estimate and likely ranges in the gray bars includes the AOGCMs in the left part of the figure, as well as results from a hierarchy of independent models and observational constraints (Figs and 10.29) IPCC AR4. 8.")
9
我們的未來:暖化的地球 10 IPCC AR4

10
氣候變遷型態

11
more frequent hot days throughout the 21st century
12

12
炙熱的夏季成為常態? Hot summer seasons: Almost every future summer as hot or hotter than the hottest people today have experienced Percent of northern summers (June-July-August) warmer than the warmest 95th percentile (1 in 20) for , for 2°C global average warming above the level of , or about 3°C total warming since pre-industrial times, from an analysis of the multi-model CMIP3 (Coupled Model Intercomparison Project phase 3) ensemble. {4.5} 12 From NRC
 warmer than the warmest 95th percentile (1 in 20) for , for 2°C global average warming above the level of , or about 3°C total warming since pre-industrial times, from an analysis of the multi-model CMIP3 (Coupled Model Intercomparison Project phase 3) ensemble. {4.5} 12. From NRC.")
13
森林火災越趨頻繁? Observed and reconstructed wildfire area-burned for 11 western U.S. states (bars) and reconstructed (line) for the period 1916–2004. (Fig. 1 from Littell et al., 2009) Map of changes in area burned for a 1ºC increase in global average temperature, shown as the percent change relative to the median annual area burned during Results are aggregated to ecoprovinces (Bailey 1995) of the West. Changes in temperature and precipitation were aggregated to the ecoprovince level. Climate-fire models were derived from NCDC climate division records and observed area burned data following methods described in Littell et al Figure: Rob Norheim 13 From NRC
 and reconstructed (line) for the period 1916–2004. (Fig. 1 from Littell et al., 2009) Map of changes in area burned for a 1ºC increase in global average temperature, shown as the percent change relative to the median annual area burned during Results are aggregated to ecoprovinces (Bailey 1995) of the West. Changes in temperature and precipitation were aggregated to the ecoprovince level. Climate-fire models were derived from NCDC climate division records and observed area burned data following methods described in Littell et al Figure: Rob Norheim. 13. From NRC.")
14
副熱帶雨量減少,高緯度雨量增加 Colored areas: more than 2/3 of models agree 14
Estimated changes in precipitation per degree of global warming in the three driest consecutive months at each grid point from a multi-model analysis using 22 models (relative to 1900 –1950 as the baseline period). White is used where fewer than 16 of 22 models agree on the sign of the change. One ensemble member from each model is averaged over the dry season and decadally in several indicated regions including southwestern North America and Alaska, as shown in the inset plots. Adapted from Solomon et al. (2009), with additional inset panel for Alaska (courtesy R. Knutti) provided using the same datasets and methods as in that work {4.2} Colored areas: more than 2/3 of models agree 14 From NRC
. White is used where fewer than 16 of 22 models agree on the sign of the change. One ensemble member from each model is averaged over the dry season and decadally in several indicated regions including southwestern North America and Alaska, as shown in the inset plots. Adapted from Solomon et al. (2009), with additional inset panel for Alaska (courtesy R. Knutti) provided using the same datasets and methods as in that work {4.2} Colored areas: more than 2/3 of models agree. 14. From NRC.")
15
more heavy rain events throughout the 21st century
16

16
連續無雨日與土壤濕度

17
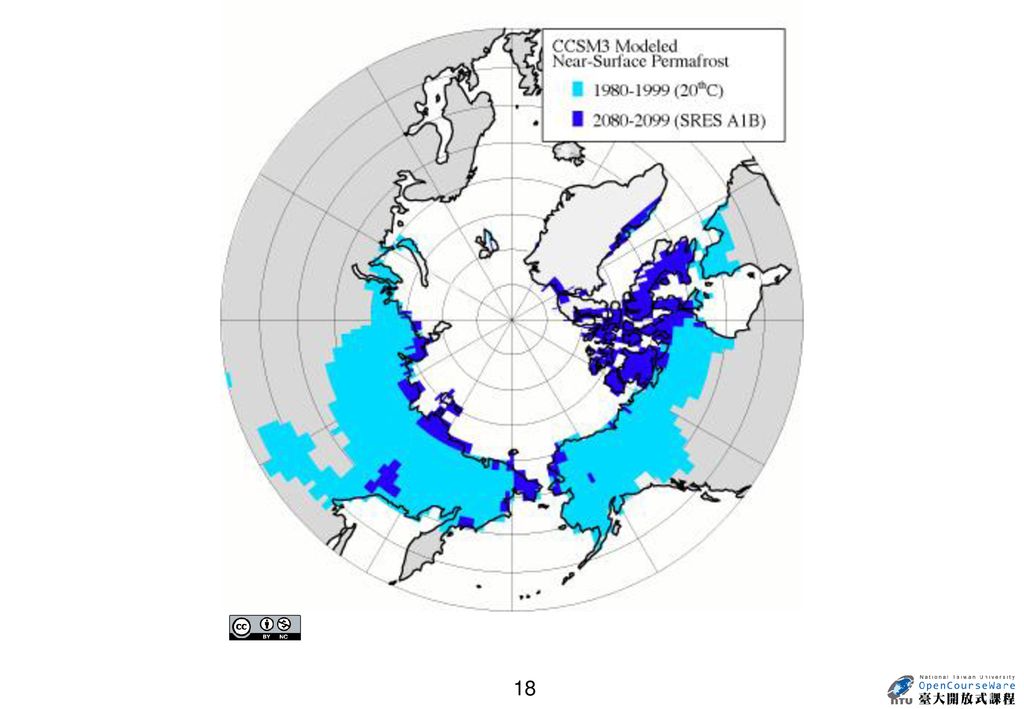
永凍層融化 18 Location of Permafrost in the Northern Hemisphere.
Glaciers and the Greenland Ice Sheet are violet, and Arctic Sea Ice is light blue. from NSIDC 18

19
北極海冰 Observed and modeled Arctic sea-ice extent

20
IPCC低估近30年海平面上升幅度 Sea-level change

21
未來300年海平面上升幅度 ~10公分/10年 Past and future sea-level projections

22
海平面上升熱點區 From NRC

23
糧食減產 畜產、農產、水果、糧食價格、總類、… 23 From NRC
Projected changes in yields of several crops worldwide as a function of global warming (relative to pre-industrial temperatures) in the absence of adaptation. Best estimates and likely uncertainty ranges are shown. {5.1} Illustration of how temperature change in degrees Celsius (left side of thermometer) relates to temperature change in degrees Fahrenheit (right side of thermometer). For example, a warming of 5 degrees Celsius is equal to a warming of 9 degrees Fahrenheit. In this report estimates of temperature change are made in degrees Celsius in accordance with international scientific practice. 畜產、農產、水果、糧食價格、總類、… 23 From NRC
 in the absence of adaptation. Best estimates and likely uncertainty ranges are shown. {5.1} Illustration of how temperature change in degrees Celsius (left side of thermometer) relates to temperature change in degrees Fahrenheit (right side of thermometer). For example, a warming of 5 degrees Celsius is equal to a warming of 9 degrees Fahrenheit. In this report estimates of temperature change are made in degrees Celsius in accordance with international scientific practice. 畜產、農產、水果、糧食價格、總類、… 23. From NRC.")
24
Projected Changes in Agricultural Productivity

25
海洋酸化、珊瑚礁大量死亡 Schematic indicating the effects on seawater carbonate chemistry due to the uptake of excess carbon dioxide (CO2) from the atmosphere. Ocean acidification causes increases in some chemical species (red) and decreases in other species (blue). Ocean acidification also causes a reduction in pH (pH = - log10[H+]) and the saturation states, , of calcium carbonate minerals in shells and skeletons of planktonic and benthic organisms and in carbonate sediments. On millennial and longer time-scales, ocean pH perturbations are buffered by external inputs of alkalinity, denoted by calcium ions (Ca2+) and changes in the net burial rate of carbonate sediments. (left panel) Variation in pH of global mean surface waters with CO2. (right panel) Global coral reef distribution and their net community calcification, the biological production of calcium carbonate skeleton or shell material, relative to their pre-industrial rate (280 ppm), in percent, taking into account both ocean acidification and thermal bleaching, the loss of algal symbionts in response to warming and other stressors, for each reef location at CO2 stabilization levels of 380, 450 and 560 ppm. (from Silverman et al. 2009). {4.9; 5.7} From NRC
 from the atmosphere. Ocean acidification causes increases in some chemical species (red) and decreases in other species (blue). Ocean acidification also causes a reduction in pH (pH = - log10[H+]) and the saturation states, , of calcium carbonate minerals in shells and skeletons of planktonic and benthic organisms and in carbonate sediments. On millennial and longer time-scales, ocean pH perturbations are buffered by external inputs of alkalinity, denoted by calcium ions (Ca2+) and changes in the net burial rate of carbonate sediments. (left panel) Variation in pH of global mean surface waters with CO2. (right panel) Global coral reef distribution and their net community calcification, the biological production of calcium carbonate skeleton or shell material, relative to their pre-industrial rate (280 ppm), in percent, taking into account both ocean acidification and thermal bleaching, the loss of algal symbionts in response to warming and other stressors, for each reef location at CO2 stabilization levels of 380, 450 and 560 ppm. (from Silverman et al. 2009). {4.9; 5.7} From NRC.")
27
自然變化?人為影響?

28
「全球暖化」是情境推估,不是預測。情境不成立,推估就不成立。 推估工具(有史以來最佳氣候模式)不完美。
全球暖化推估有相當的不確定性,不是純科學問題,是抉擇,是風險評估與管理的問題。 問題:「在高風險全球暖化的預告(有無更好的預告?)下,應該採取哪些有效的因應措施,降低預估情境發生的可能性,將衝擊降到最低? 」 28
下,應該採取哪些有效的因應措施,降低預估情境發生的可能性,將衝擊降到最低? 」 28.")
29
核心問題: 生活環境的適應能力降低 人類社會的脆弱度變高 無論有無氣候變遷 天氣與氣候的衝擊都將越來越大? 溫室氣體的增加無可避免,地球進入 一個前所未知的高溫氣候的可能性極 高。 只能減緩,無法避免?還有多少時間? (社會變遷+氣候變遷)的總效應?
的總效應?")
30
台灣 - 易澇且易旱 天然災害威脅高居世界第一
世界銀行2005年刊行之 Natural Disaster Hotspots – A Global Risk Analysis 指出,台灣同時暴露於三項以上天然災害之土地面積與面臨災害威脅之人口均為73%,高居世界第一;台灣同時暴露於兩項以上天然災害之土地面積與面臨災害威脅之人口均為99%。

31
Future on the Wheel of Fortune
Good Luck! The Joint Program on the Science and Policy of Global Change, MIT

32
溫室氣體排放持續增加 石油 煤 天然氣 燃燒化石燃料排放的CO2量快速上升

33
CO2 CH4 IPCC AR4 2005年 CO2 、 CH4 濃度遠超過 過去65萬年的自然變化範圍

34
河川逕流量變遷 From NRC

35
大災難:許多小災害同時發生的結果(?) 台灣: 天命:颱風、豪雨、乾旱 地害:921大地震 人禍:不當開發、錯誤政策、人為疏失 環境臨界點+小天災 大災難 如果人為暖化難以避免, 對台灣(水文)環境有何影響? 大災難發生的頻率會升高?
環境有何影響? 大災難發生的頻率會升高?")
36
調適與防治:全新的觀念(防避災、生活型態、 本地環境問題=全球環境問題 環境問題=契機 ! 坦然面對,竭盡所能: 個人 (內化) 研究 教育
正面思考: 風險的概念(現代化科學觀念) 調適與防治:全新的觀念(防避災、生活型態、 疾病、環境、能源、…) 本地環境問題=全球環境問題 環境問題=契機 ! 坦然面對,竭盡所能: 個人 (內化) 研究 教育 政策 (產業、能源、環境、…; 最有效!最困難?) 企業 36
 調適與防治:全新的觀念(防避災、生活型態、 疾病、環境、能源、…) 本地環境問題=全球環境問題. 環境問題=契機 ! 坦然面對,竭盡所能: 個人 (內化) 研究. 教育. 政策 (產業、能源、環境、…; 最有效!最困難?) 企業. 36.")
37
化石燃料 全球暖化 替代能源 節能減碳 石油枯竭 新科技 - 綠色科技革命?人類的出路?

38
版權聲明 2 3 4 頁碼 作品 版權標示 作者 / 來源 wikispaces / wsitime2learn
( 瀏覽日期 2012/03/14。 3 WIKIPEDIA ( 4 EARTH SIMULATOR ( 瀏覽日期 2012/03/14,依著作權法第 46、52、65 條合理使用。 ( Flickr / harunire (

39
4 5 6 7 8 頁碼 作品 版權標示 作者 / 來源 EARTH SIMULATOR
( 瀏覽日期 2012/03/14,依著作權法第 46、52、65 條合理使用。 5 WIKIPEDIA ( 2012/03/16。 6 The AR4 Synthesis Report,頁 40 ( 瀏覽日期 2012/03/16,依著作權法第 46、52、65 條合理使用。 7 UNEP-Presentations and Graphics-SPM5 ( 瀏覽日期 2012/03/16。依著作權法第 46、52、65 條合理使用。 8 The AR4 Synthesis Report,頁 46

40
9 10 11 12 頁碼 作品 版權標示 作者 / 來源 The AR4 Synthesis Report,頁 46
( 瀏覽日期 2012/03/16,依著作權法第 46、52、65 條合理使用。 10 NASA BLOGS :What On Earth ( 2012/03/14。依著作權法第 46、52、65 條合理使用。 11 The IPCC Special Report on Managing the Risks of Extreme Events and Disasters to Advance Climate Change Adaptation,頁 15 ( 瀏覽日期 2012/03/16。依著作權法第 46、52、65 條合理使用。 12 warming world impacts by degree,頁 20 ( According to e… ( 瀏覽日期 2012/07/31。

41
13 14 15 頁碼 作品 版權標示 作者 / 來源 Natural Resources Canada
( 瀏覽日期 2012/03/16。依著作權法第 46、52、65 條合理使用。 Gabrielle Angle and Autumn Sunshine / Gabby Angel ( 2012/03/14。 warming world impacts by degree,頁 32 ( 14 PNAS ( 15 The IPCC Special Report on Managing the Risks of Extreme Events and Disasters to Advance Climate Change Adaptation,頁 16 (

42
16 17 頁碼 作品 版權標示 作者 / 來源 Climate Citizen / takver
( 2012/03/16。 17 NOAA ( 瀏覽日期 2012/03/16。依著作權法第 46、52、65 條合理使用。 WIKIPEDIA ( 瀏覽日期 2012/03/16。 ( (

43
頁碼 作品 版權標示 作者 / 來源 17 NOAA ( 瀏覽日期 2012/03/16。依著作權法第 46、52、65 條合理使用。 18 Un Universo invisible bajo nuestros pies / Juan José Ibáñez ( 瀏覽日期 2012/03/16。 19 Skeptical Science ( 瀏覽日期 2012/03/16。 The Copenhagen Diagnosis ( 20 warming world impacts by degree,頁 24 (
, 瀏覽日期 2012/03/16。 The Copenhagen Diagnosis. ( 20. warming world impacts by degree,頁 24. (")
44
21 22 23 24 頁碼 作品 版權標示 作者 / 來源 Knowledge Project
( 2012/03/16。 依著作權法第 46、52、65 條合理使用。 22 warming world impacts by degree,頁 30 ( 瀏覽日期 2012/03/16。依著作權法第 46、52、65 條合理使用。 23 warming world impacts by degree,頁 28 Earth Friendly Gardening / CAROLINE BROWN ( 瀏覽日期 2012/03/14。 24 UNEP ( 2012/03/16。

45
25 26 27 30 頁碼 作品 版權標示 作者 / 來源 CARNEGIE SCIENCE
( 2012/03/16。依著作權法第 46、52、65 條合理使用。 photozou /かっこいいパパの部屋 ( 瀏覽日期 2012/03/16。 26 ( 2012/03/16。依著作權法第 46、52、65 條合理使用。 27 Plants Need CO2 ( 2012/03/16。依著作權法第 46、52、65 條合理使用。 30 Natural Disaster Hotspots – A Global Risk Analysis ( 2012/03/16。 依著作權法第 46、52、65 條合理使用。
,瀏覽日期 2012/03/16。依著作權法第 46、52、65 條合理使用。 30. Natural Disaster Hotspots – A Global Risk Analysis. ( 2012/03/16。 依著作權法第 46、52、65 條合理使用。")
46
頁碼 作品 版權標示 作者 / 來源 30 交通部中央氣象局( 2012/03/16。依著作權法第 46、52、65 條合理使用。 世界銀行……均為 99%。 臺灣綠色經濟發展思維 ( 8, 瀏覽日期 2012/04/11。依著作權法第 46、52、65 條合理使用。 31 The MIT Joint Program on the Science and Policy of Global Change ( 32 Climate Related Charts and Graphs ( 2012/03/16。依著作權法第 46、52、65 條合理使用。

47
頁碼 作品 版權標示 作者 / 來源 33 IPCC ( 瀏覽日期 2012/03/16。依著作權法第 46、52、65 條合理使用。 34 warming world impacts by degree,頁 31 (

Similar presentations


 (更新日期: 2016年2月) 氣候變化在過去幾十年不僅是國際科學界的研究焦點之一,近年更成>")


