Download presentation
Presentation is loading. Please wait.

1
微積分網路教學課程 應用統計學系 周 章

2
網路教學課程第七講 1. 凹性與反曲點 2. 函數圖形之描繪

3
網路教學課程第七講 1. 凹性與反曲點 2. 函數圖形之描繪

4
Concavity 凹性 Concavity (凹性) . The graph of a differentiable function f (x) on an open interval I is called concave up (上凹) on I : if each of the lines tangent to the graph of the function on I lies below the graph; concave down (下凹) on I : if each of the lines tangent to the graph of the function on I lies above the graph .
 on I : if each of the lines tangent to the graph of the function on I lies below the graph; concave down (下凹) on I : if each of the lines tangent to the graph of the function on I lies above the graph .")
5
函數圖形之凹性

6
上凹 在圖中所表示之曲線,其切線皆在曲線之下方,此種曲線稱為上凹(Concave upward)
")
7
下凹 Concave downward 圖中所表示之曲線,其切線皆在曲線之上方,此種曲線稱為下凹

8
切線斜率與凹性 由圖觀之,曲線之凹向性可由其切線斜率之變動情形決定之。當有一點在曲線上由左向右移動時,若曲線為上凹,則過點之切線斜率將隨點之右移而增大;反之,若曲線為下凹,則過點之切線斜率將隨點之右移而減小。

9
一階導數之增減與凹性

10
一階導數之增減與凹性 在區間 I 中 為遞增 f 為上凹

11
一階導數之增減與凹性 在區間 I 中 為遞增 f 為上凹 為遞減 f 為下凹

12
雲霄飛車 – 1

13
雲霄飛車 – 2

14
雲霄飛車 – 3

15
雲霄飛車 – 4

16
雲霄飛車 – 5

17
雲霄飛車 – 6

18
雲霄飛車 – 7

19
雲霄飛車 – 8

20
單調性(Monotonicity)定理
定理")
21
單調性(Monotonicity)定理 若函數 f 在區間 I 的微分函數 > 0 則函數 f 在區間 I 為遞增。
定理 若函數 f 在區間 I 的微分函數 > 0 則函數 f 在區間 I 為遞增。")
22
雲霄飛車 – 2

23
雲霄飛車 – 3

24
雲霄飛車 – 4

25
雲霄飛車 – 5

26
雲霄飛車 – 6

27
單調性(Monotonicity)定理 若函數 f 在區間 I 的微分函數 > 0 則函數 f 在區間 I 為遞增。
定理 若函數 f 在區間 I 的微分函數 > 0 則函數 f 在區間 I 為遞增。")
28
與凹性 由單調性(Monotonicity)定理,我們已經知道增函數之導數為正,而減函數之導數為負。 綜合上面的討論,我們可知:
上凹曲線之 之導數為正,即 為正; 下凹曲線之 之導數為負,即 為負。

29
與凹性 由單調性(Monotonicity)定理,我們已經知道增函數之導數為正,而減函數之導數為負。 綜合上面的討論,我們可知:
上凹曲線之 之導數為正,即 為正; 下凹曲線之 之導數為負,即 為負。

30
How the graph of a function "bends" at a point
moving-concavity.html

31
二階導數與凹性 Theorem. If the second derivative of a function exists everywhere on an open interval I then its graph is (i) concave up on I if for all x in I ; (ii) concave down on I if for all x in the interval I . Proof: If f(x) is twice differentiable and f’’(x) > 0 on I then the slope of the tangent, f’(x); increases, so that the tangent lies below the graph of f(x) on I: If on the other hand f’’(x) < 0 on I then the slope of the tangent, f’(x); decreases, so that the tangent lies above the graph of f(x) on I:
 concave up on I if for all x in I ; (ii) concave down on I if for all x in the interval I . Proof: If f(x) is twice differentiable and f’’(x) > 0 on I then the slope of the tangent, f’(x); increases, so that the tangent lies below the graph of f(x) on I: If on the other hand f’’(x) < 0 on I then the slope of the tangent, f’(x); decreases, so that the tangent lies above the graph of f(x) on I:")
32
Inflection Point 反曲點 Definition:
Any point (c, f (c)) where the graph of a continuous function changes direction of concavity is called an inflection point.
) where the graph of a continuous function changes direction of concavity is called an inflection point.")
33
反曲點 函數之曲線在一點之左右兩側凹性不同時, 即有一側為上凹,另一側為下凹時,則產生反曲點 (inflection point)
")
34
函數圖形之凹性與反曲點

35
反曲點 之求法

36
反曲點 之求法

37
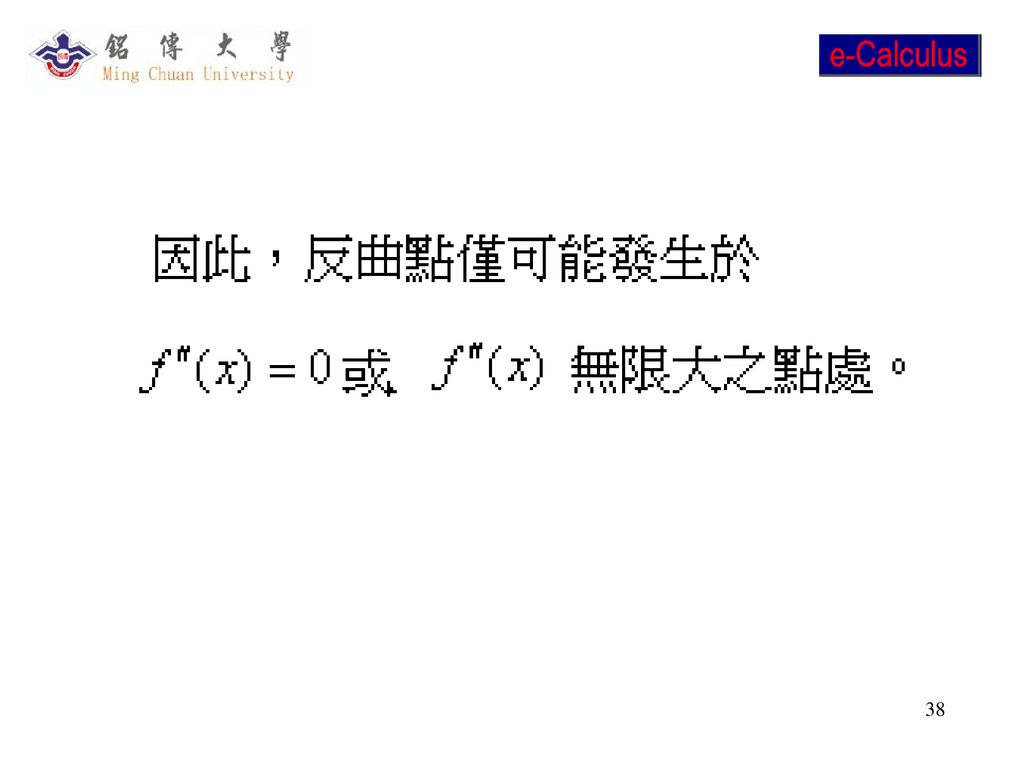
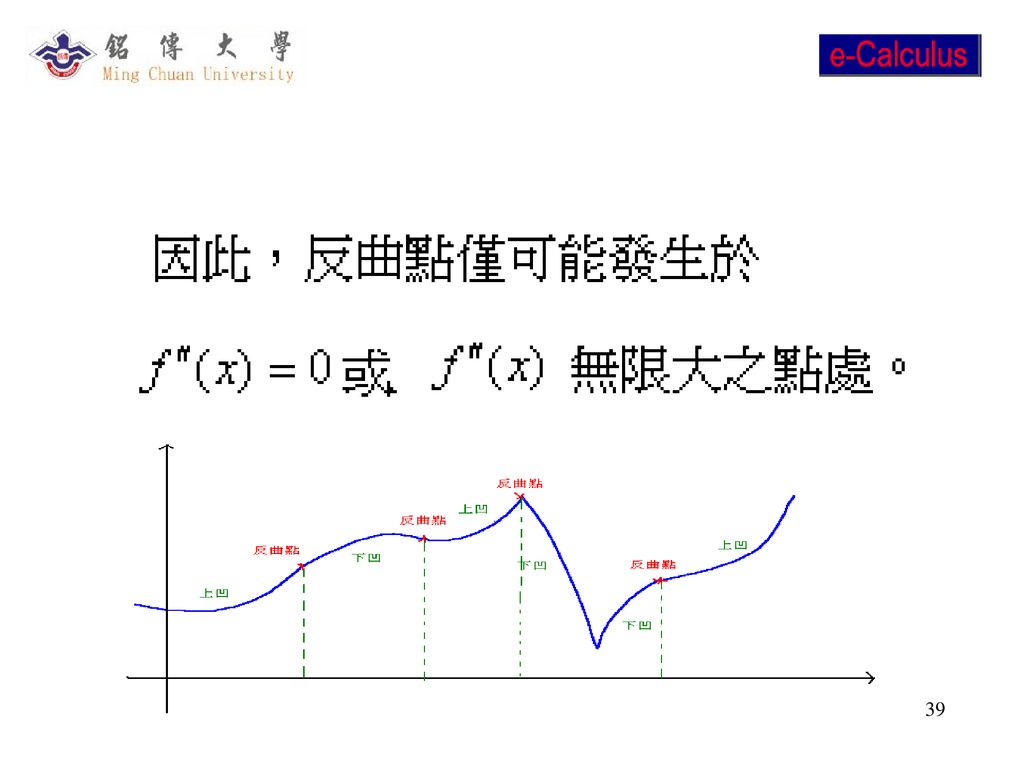
反曲點 之求法

40
二階導數不存在

41
注意 當二階導數在某點之值為零或無限大時,並不保證該點就是圖形之反曲點 如下圖所示,

42
如圖所示, 但原點不為反曲點

43
不存在 二階導數在 x = 0 之值為正負無限大, 而不存在時; 原點不為反曲點

44
例 題 1

45
例 題 1- 續

46
例 題 1- 續

47
例 題 1- 續

48
例 題 1- 續

49
習題

50
習題

51
網路教學課程第七講 1. 凹性與反曲點 2. 函數圖形之描繪

52
Critical points 臨界點

53
導數不存在

54
Cusp - 導數不存在:

55
The graph of

56
Second derivative test for maxima and minima

57
Second derivative test for maxima and minima
Theorem. If c is a critical number such that , then:

58
Second derivative test for maxima and minima
Theorem. If c is a critical number such that , then: The point (c; f (c)) is a relative minimum if
) is a relative minimum if.")
59
Second derivative test for maxima and minima
Theorem. If c is a critical number such that , then: The point (c; f (c)) is a relative minimum if ii) The point (c; f (c)) is a relative maximum if
) is a relative minimum if. ii) The point (c; f (c)) is a relative maximum. if.")
60
Example: Local extrema
Consider the function f (x) is a polynomial function. Therefore it is continuous and differentiable everywhere.
 is a polynomial function. Therefore it is continuous and differentiable everywhere.")
61
Taking the derivative we get

62
Taking the derivative we get
So we have

63
So f (x) is increasing on the intervals and , and f (x) is decreasing on the interval [-1,2].
![So f (x) is increasing on the intervals and , and f (x) is decreasing on the interval [-1,2].](http://slidesplayer.com/slide/14513904/90/images/63/So+f+%28x%29+is+increasing+on+the+intervals+and+%2C+and+f+%28x%29+is+decreasing+on+the+interval+%5B-1%2C2%5D..jpg "So f (x) is increasing on the intervals and , and f (x) is decreasing on the interval [-1,2].")
64
Graph of f(x) and At x = -1 the function behaves like a point at the top of a hill while at x = 2 the graph looks like a valley.
 and At x = -1 the function behaves like a point at the top of a hill while at x = 2 the graph looks like a valley.")
65
Example

66
Example First let us find the critical points. The function f (x) is rational and is defined for any x. In fact, f (x) is differentiable for any x. Moreover we have
 is rational and is defined for any x. In fact, f (x) is differentiable for any x. Moreover we have.")
68
So implies

69
So implies Since

70
Then the first-derivative test implies that x = -1 is a local minimum and x = 1 is a local maximum.

71
Then the first-derivative test implies that x = -1 is a local minimum and x = 1 is a local maximum.

72
描繪一般函數圖形之步驟 討論函數之定義域與值域,以決定曲線範圍。 求出圖形在座標軸上之截距。 討論圖形之對稱性。 討論圖形是否有漸近線。
討論函數之定義域與值域,以決定曲線範圍。 求出圖形在座標軸上之截距。 討論圖形之對稱性。 討論圖形是否有漸近線。 求出臨界點,函數增減區間之測定,決定圖形之極大點、極小點。 凹性及反曲點之測定。 圖形之描繪。

73
多項式函數圖形之描繪

74
多項式函數圖形之描繪

75
多項式函數圖形之描繪

76
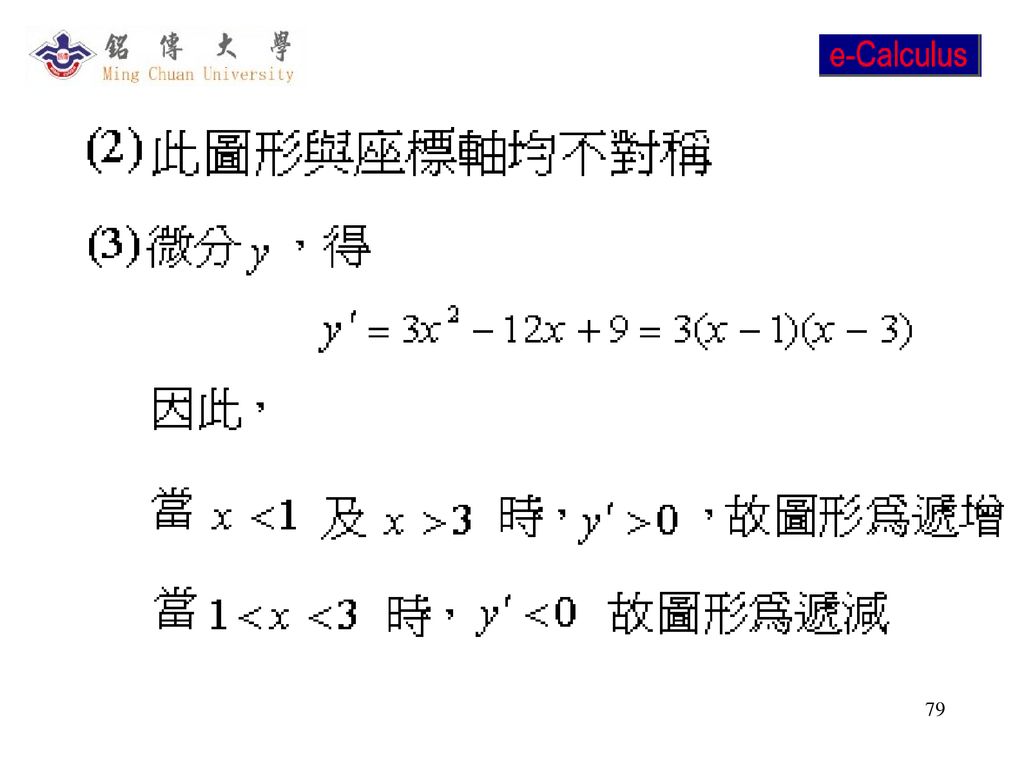
例題 1

77
例題 1

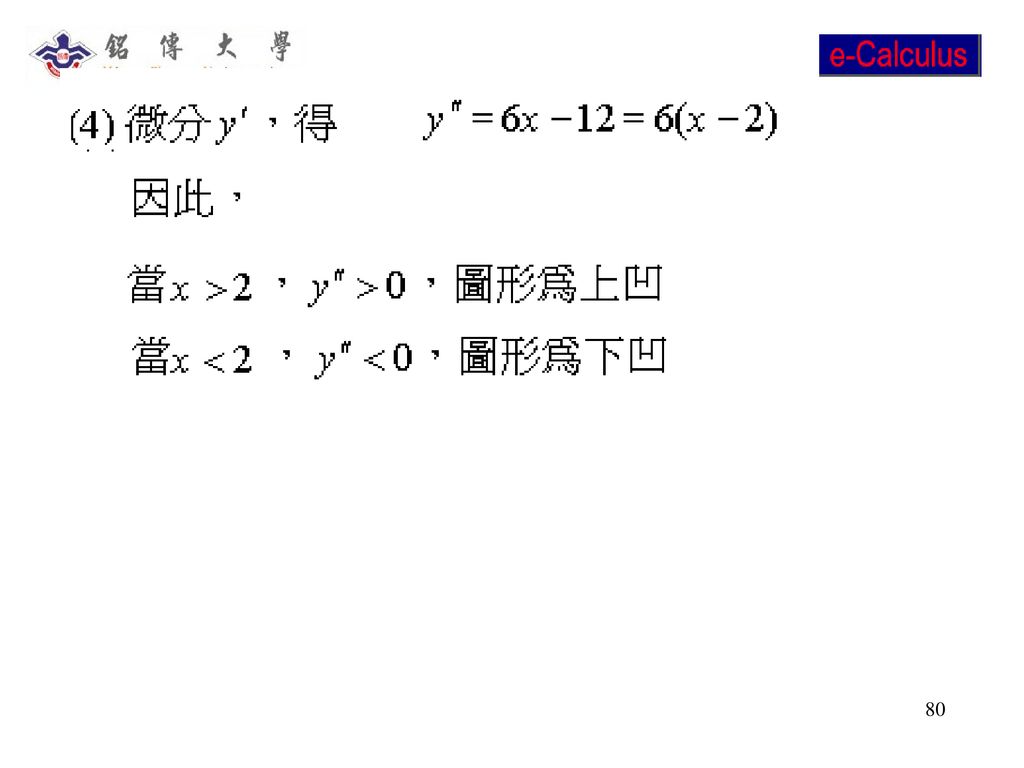
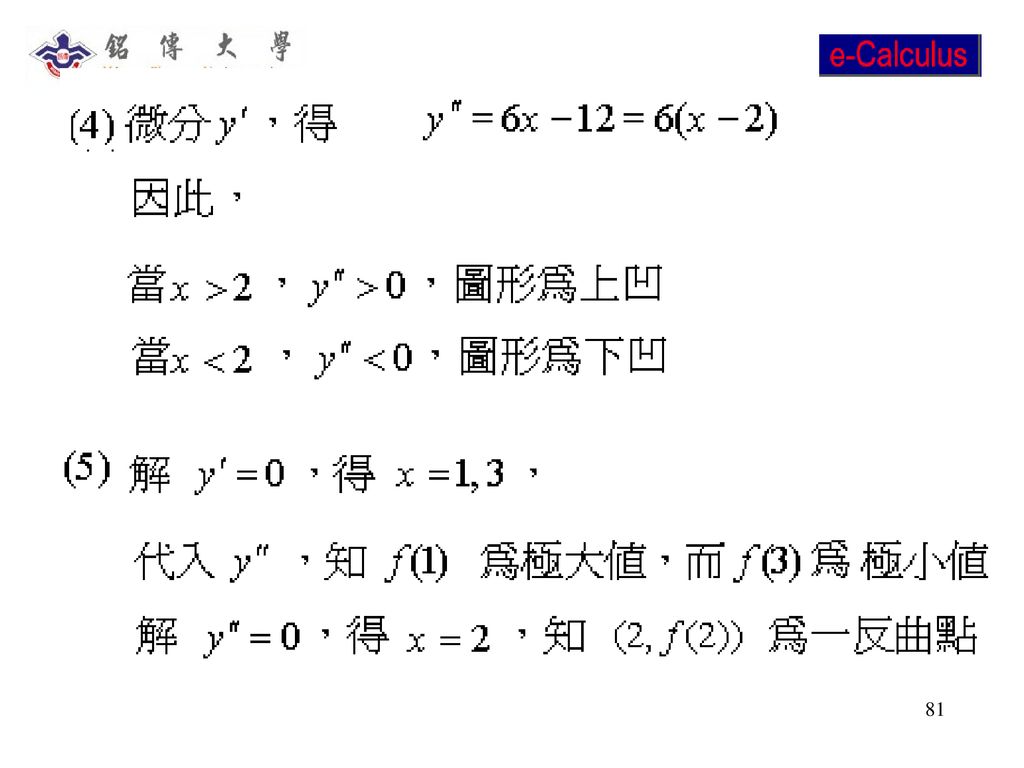
82
符號表

83
函數圖形

84
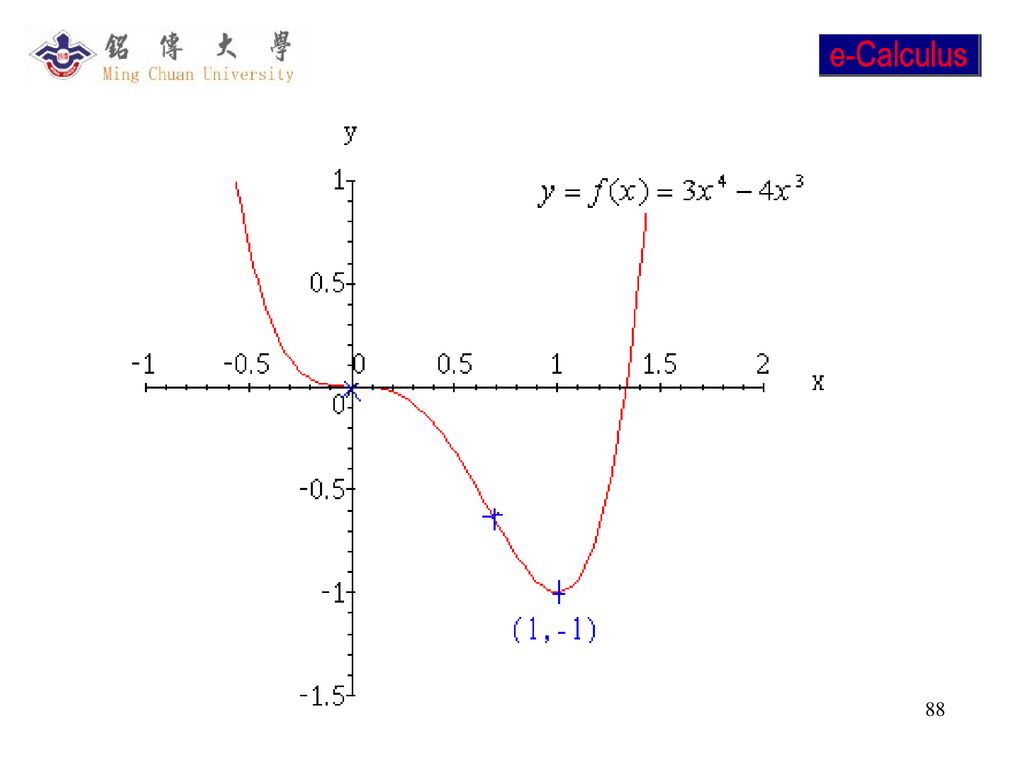
例題 2

85
例題 2

86
例題 2

87
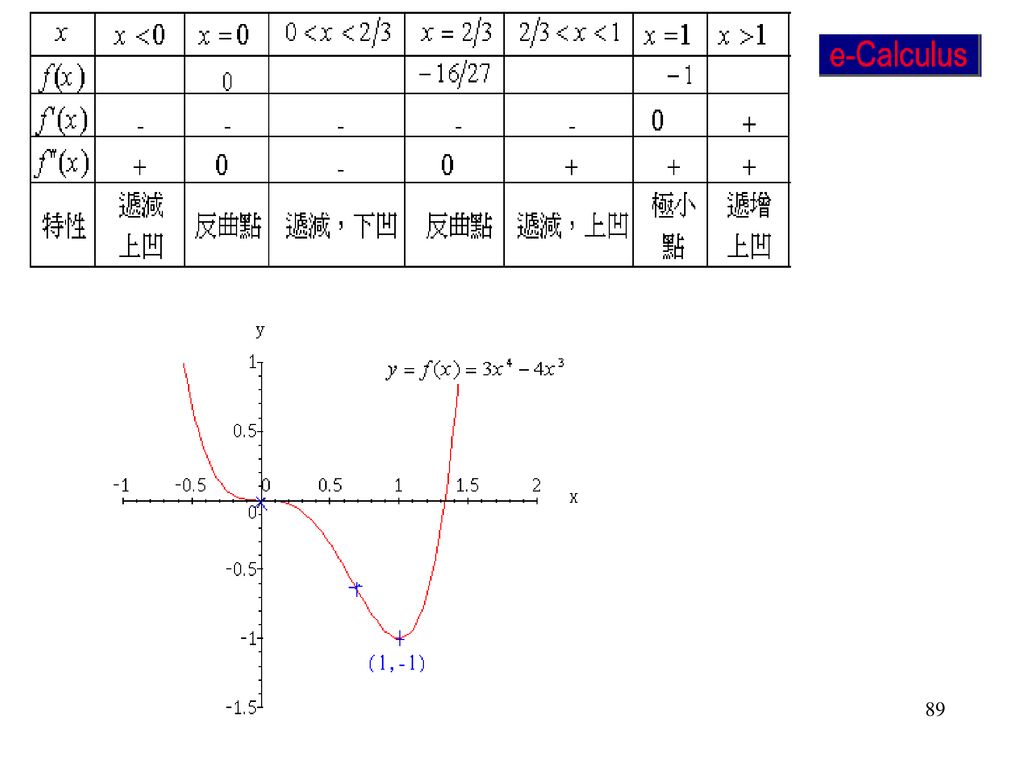
符號表

90
有理函數圖形之描繪

91
有理函數圖形之描繪

92
有理函數圖形之描繪

93
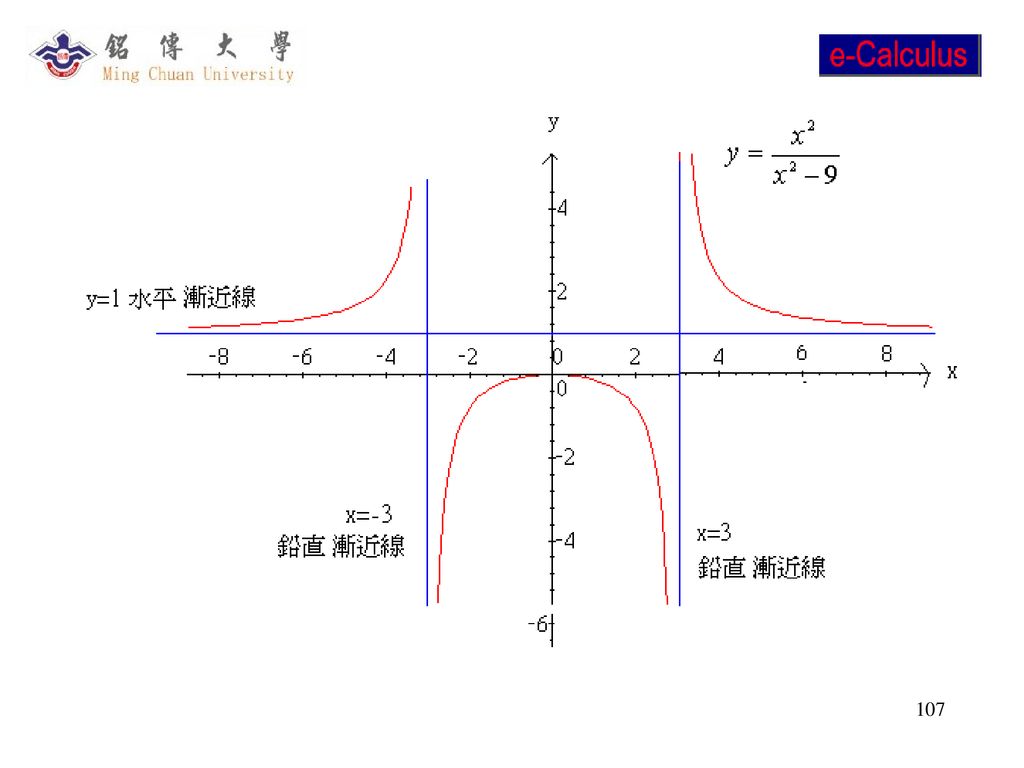
水平漸近線 Horizontal asymptote

94
鉛直漸近線 Vertical asymptote

95
漸近線

96
漸近線

97
漸近線

98
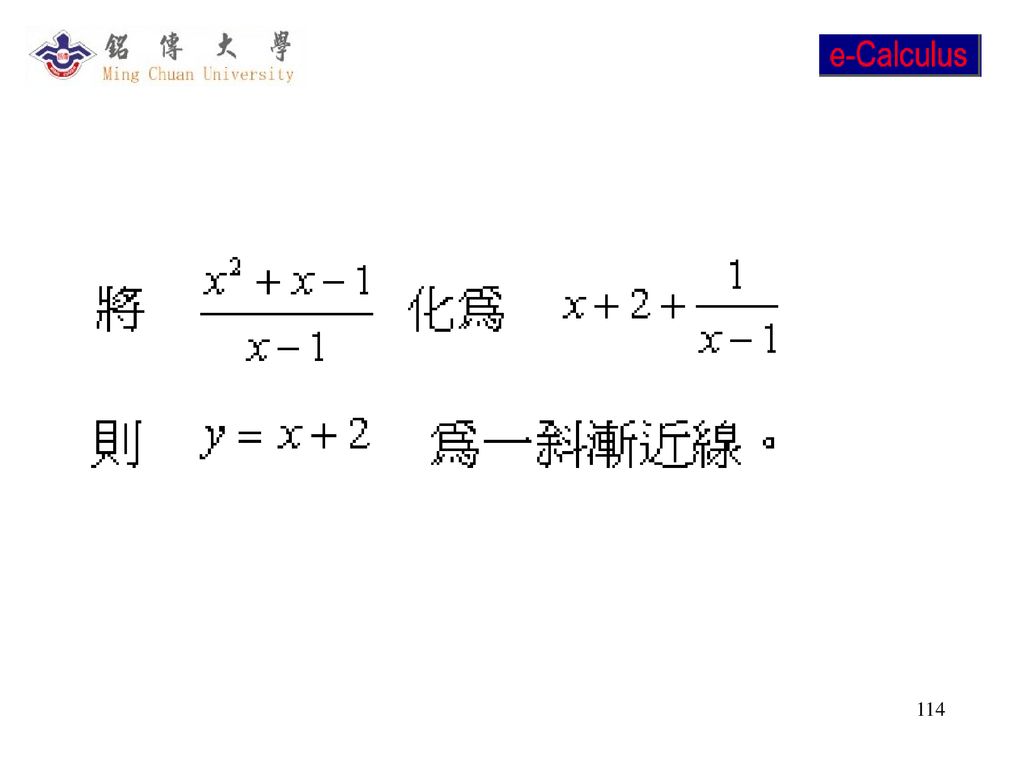
斜漸近線

99
斜漸近線

100
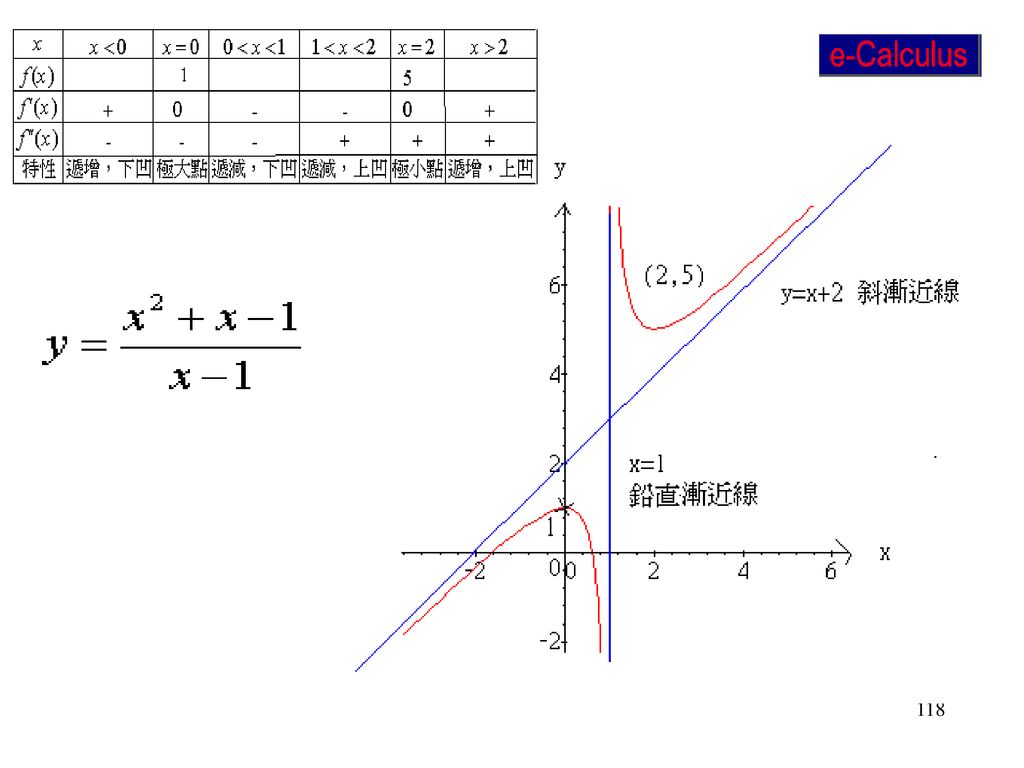
例題

101
例題

102
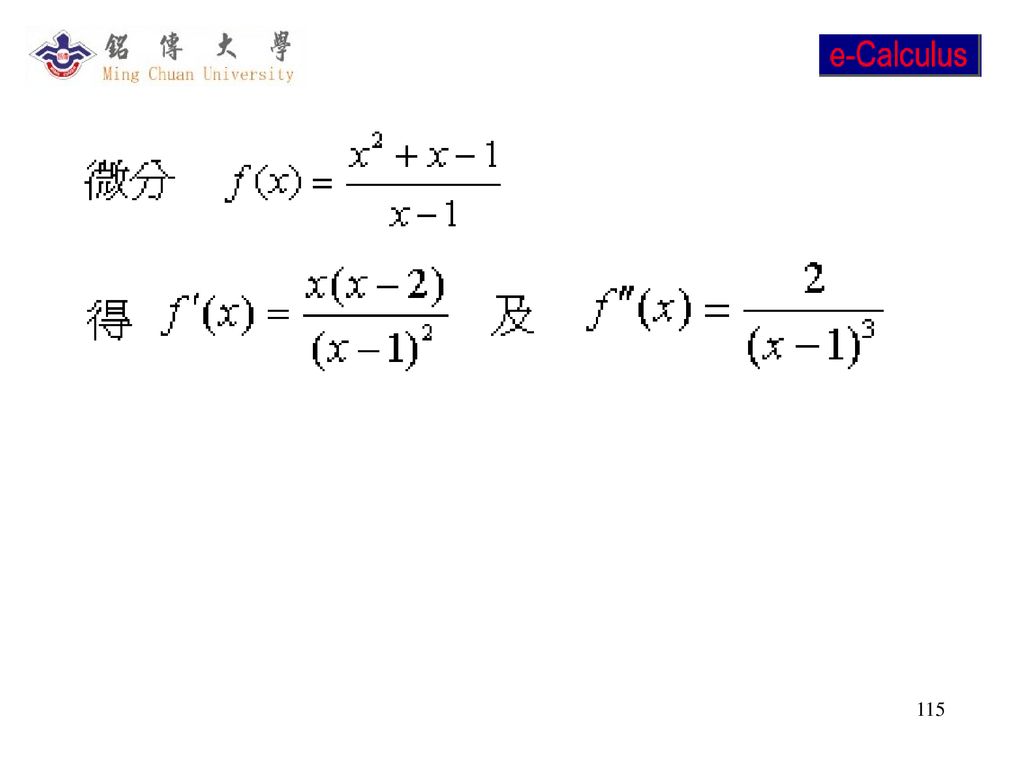
例題-續

103
例題-續

104
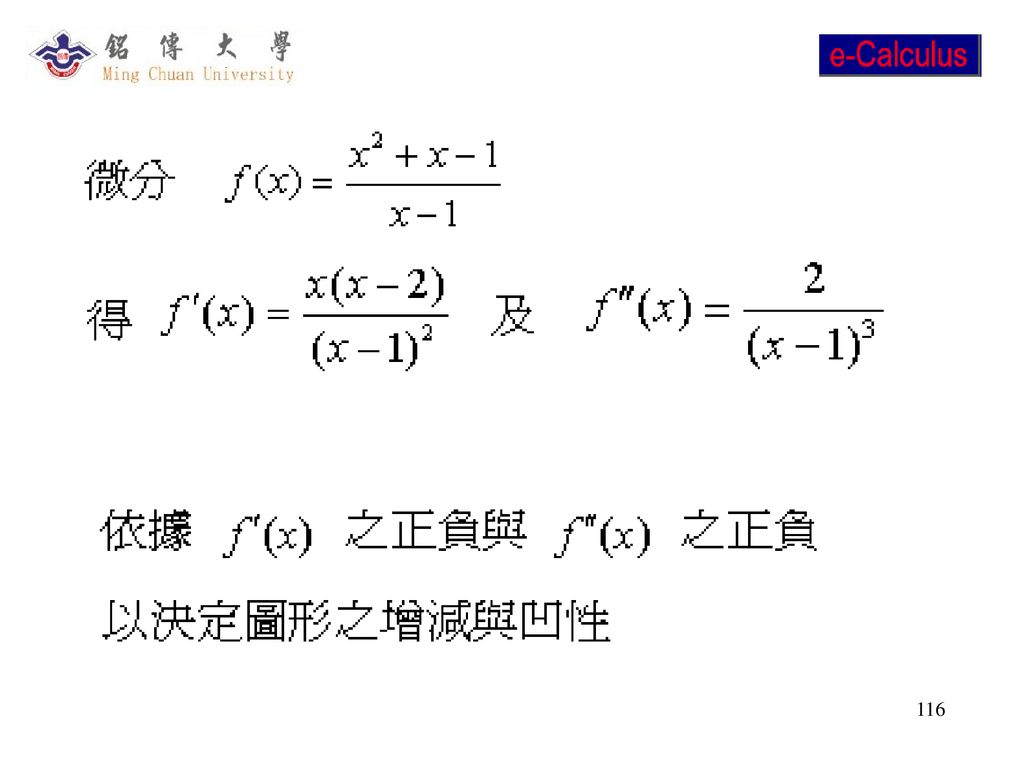
例題-續

105
例題-續

106
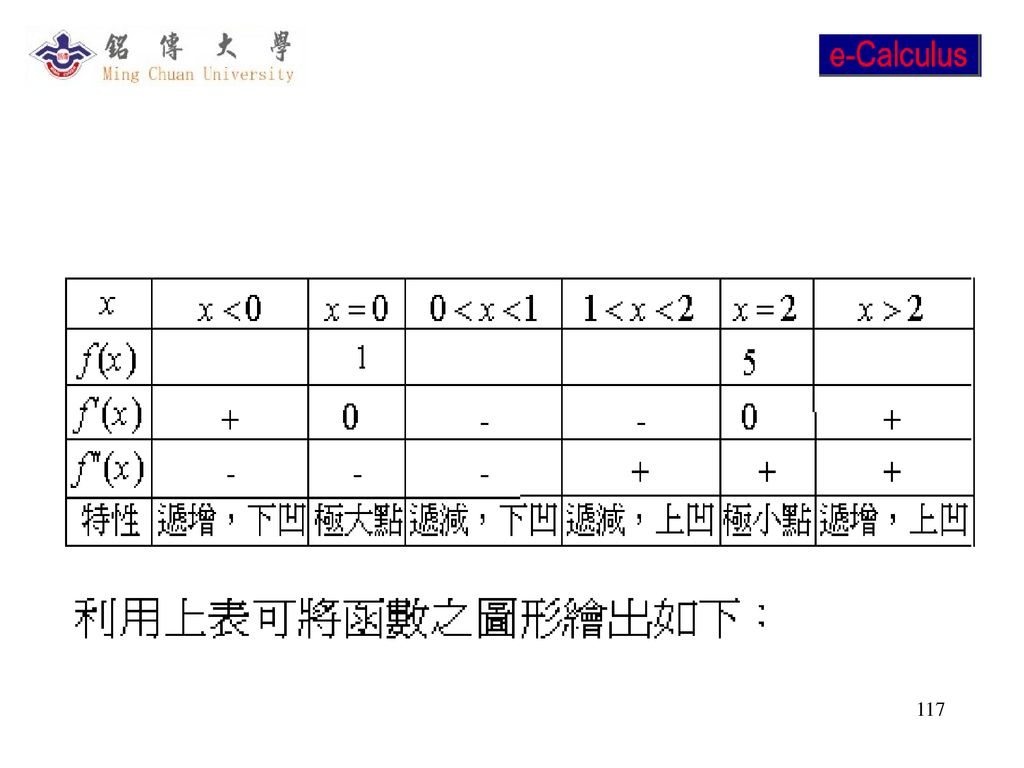
例題-續

108
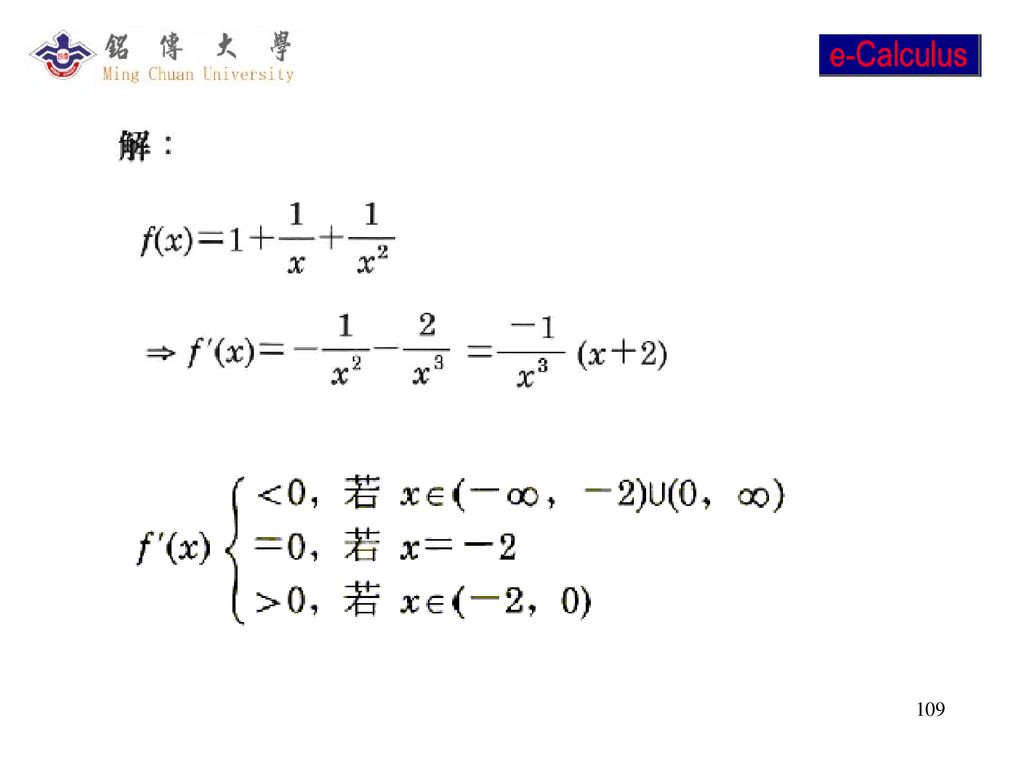
例題

112
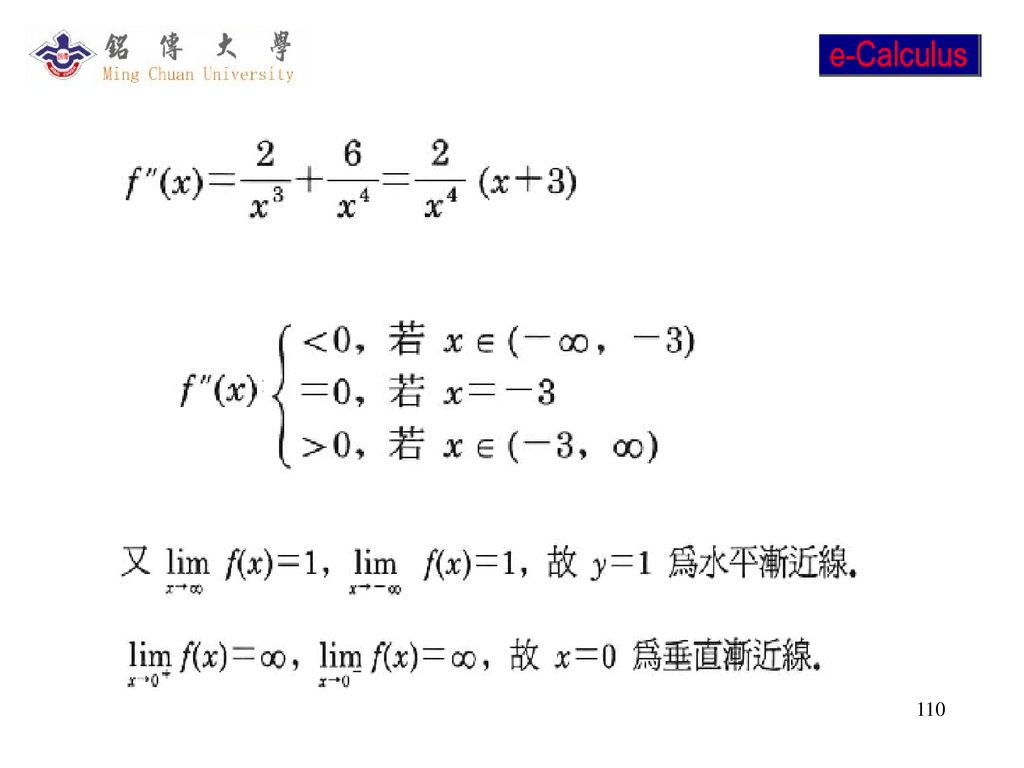
例題

113
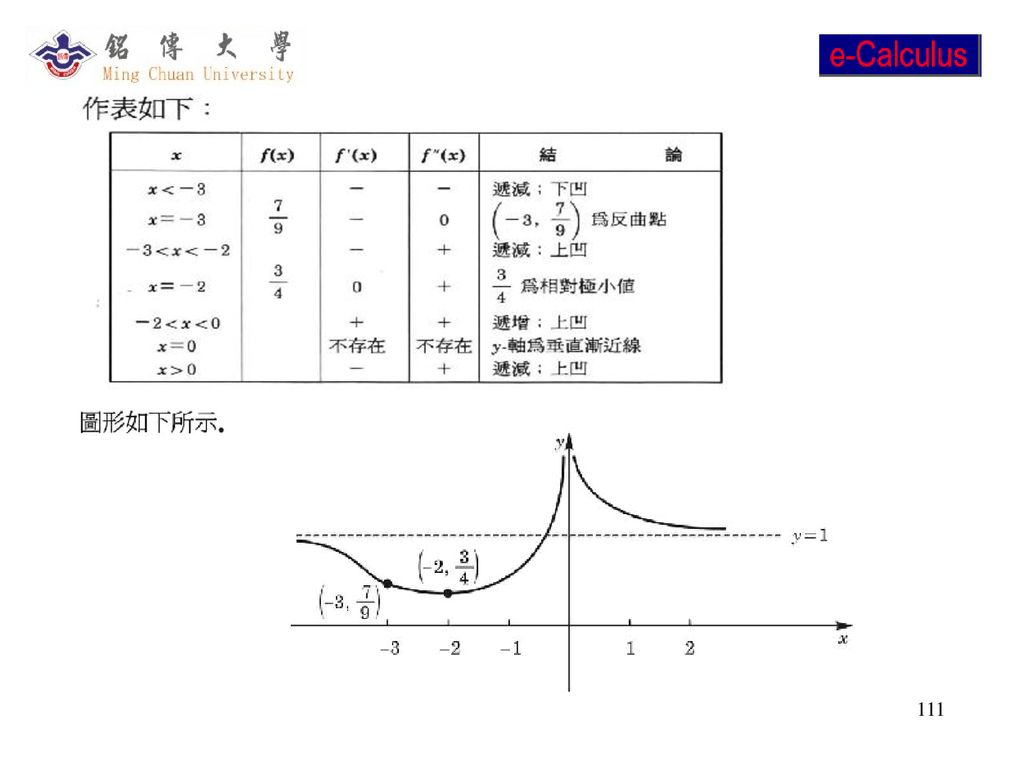
例題

119
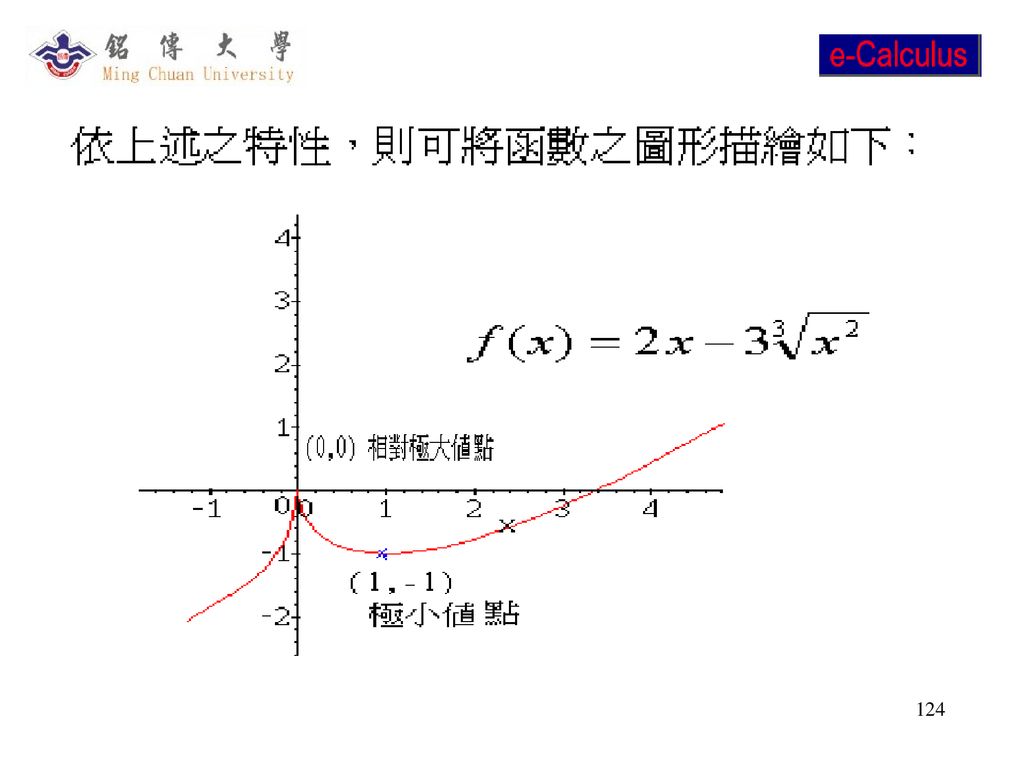
函數中含有根式之圖形描繪

120
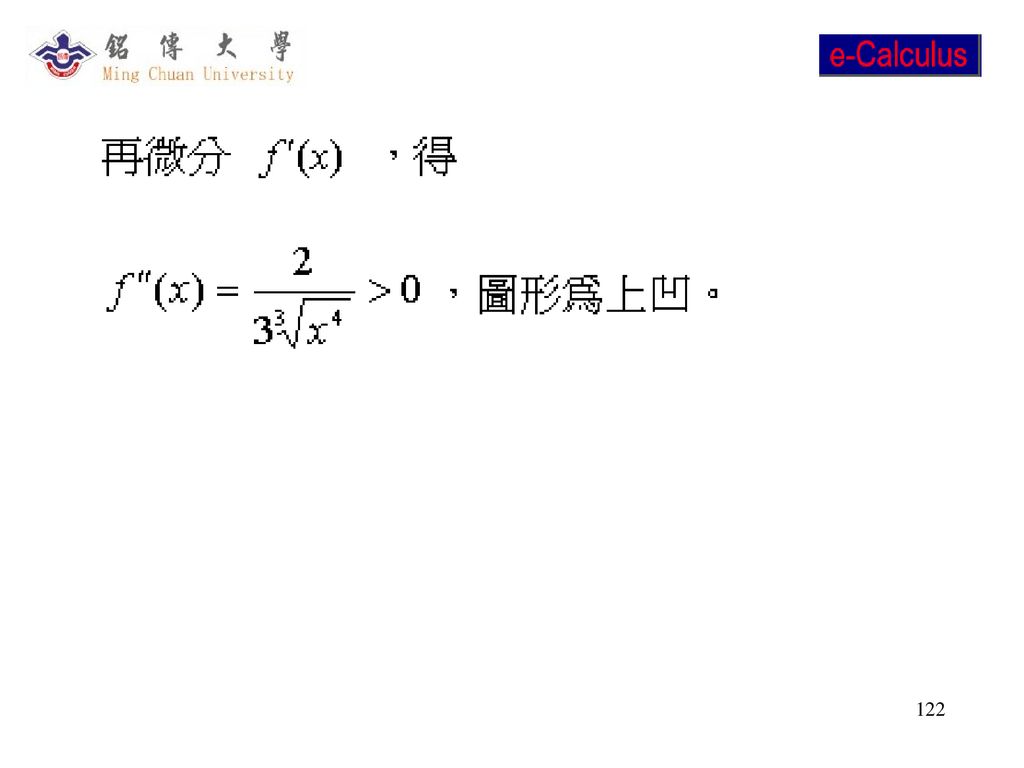
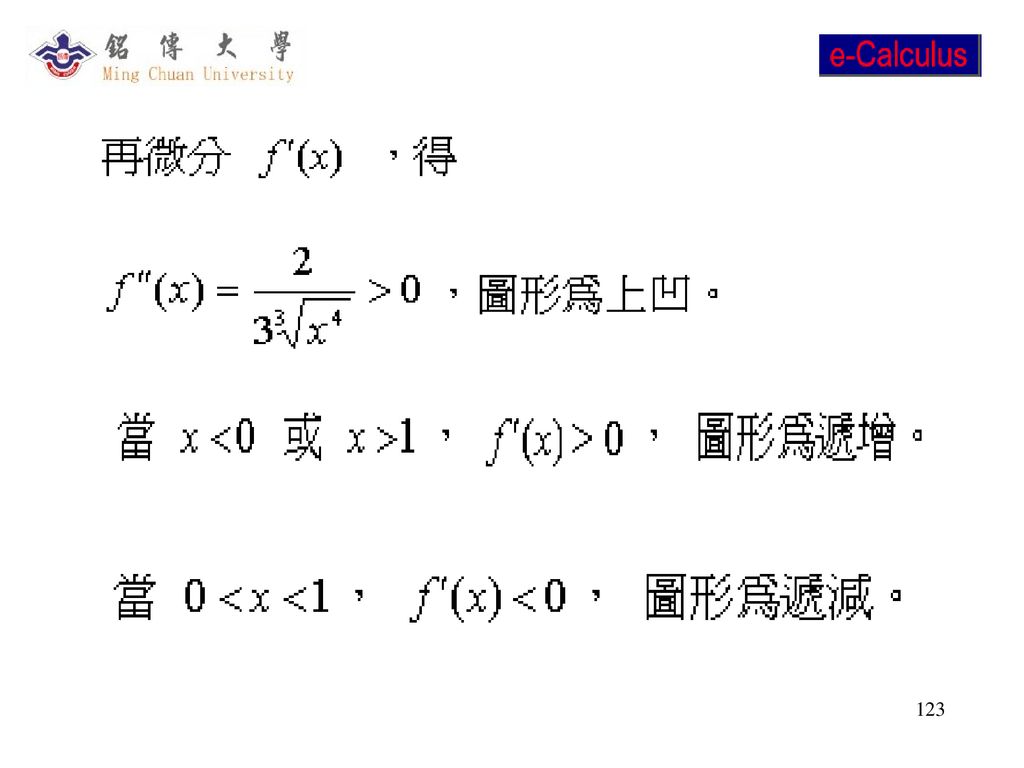
例題

121
例題

125
習題

126
習題

Similar presentations

=0 变换为 x= (x), 然后建立迭代格式, 返回下一页 则称迭代格式 收敛, 否则称为发散 上一页.>")


>")


