Download presentation
Presentation is loading. Please wait.

1
國立雲林科技大學 工業工程與管理所 課堂名稱:高等品質管理 授課老師:童超塵 副教授 國立雲林科技大學 工業工程與管理所 課堂名稱:高等品質管理 授課老師:童超塵 副教授 報告學生: 蔣步海 (9421812) 王聖權 (9221801) 林榮慶 (9421748) 張咸明 (9321809) 蔡世賢 (9421808)
 王聖權 ( ) 林榮慶 ( ) 張咸明 ( ) 蔡世賢 ( )")
3
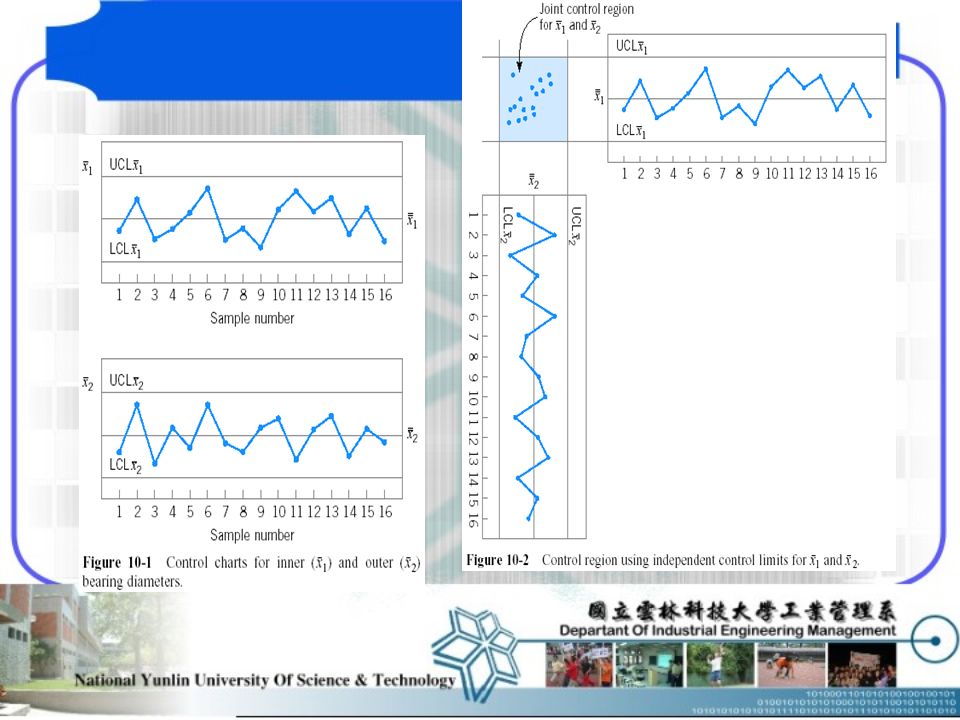
Many situations require the simultaneous monitoring or control of two or more related quality characteristics For example, consider a bearing with both an inner diameter (x 1 ) and an outer diameter (x 2 ) that together determine the usefulness of a part Monitoring the characteristics independently can be very misleading Refer to Figures 10-1 and -2 Use of multiple independent charts distorts the simultaneous monitoring of the averages Type I error and probability of a point correctly plotting in control are not equal to advertised levels for the individual control charts Distortion in process-monitoring procedures increases as the number of quality characteristics increases to Pr{all p means plot in control} = (1 ) p (10-2)
 and an outer diameter (x 2 ) that together determine the usefulness of a part Monitoring the characteristics independently can be very misleading Refer to Figures 10-1 and -2 Use of multiple independent charts distorts the simultaneous monitoring of the averages Type I error and probability of a point correctly plotting in control are not equal to advertised levels for the individual control charts Distortion in process-monitoring procedures increases as the number of quality characteristics increases to Pr{all p means plot in control} = (1 ) p (10-2)")
7
variate

9
10-3 The Hotelling T 2 Control Chart mean vectorMonitoring the mean vector of the process A direct analog of the univariate Shewhart chart Two versions of the Hotelling T 2 Control Chart Subgrouped data Individual observations

10
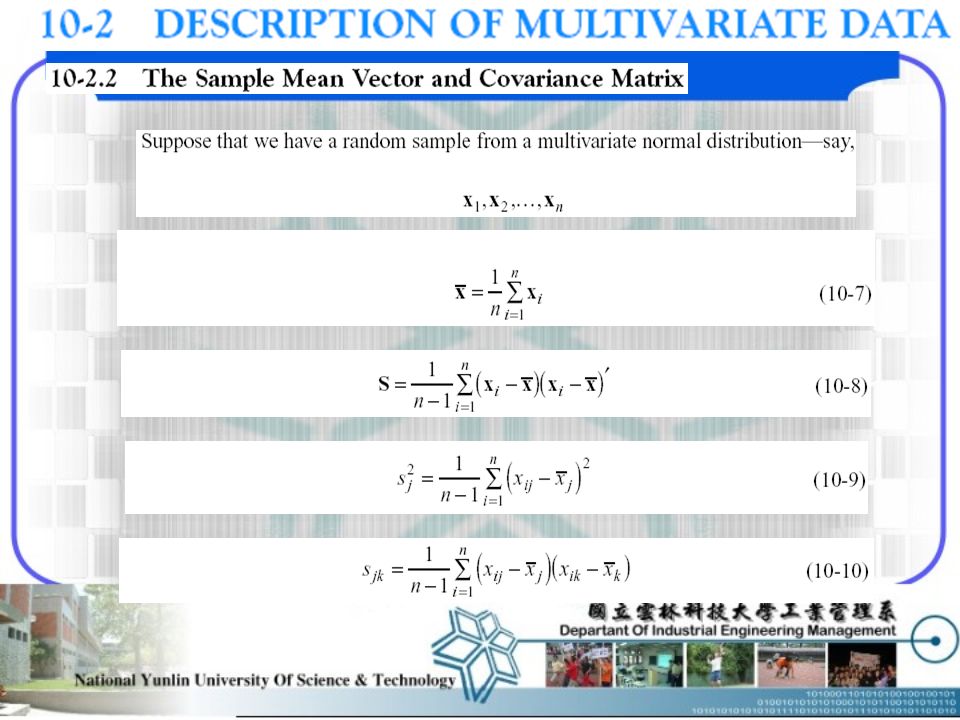
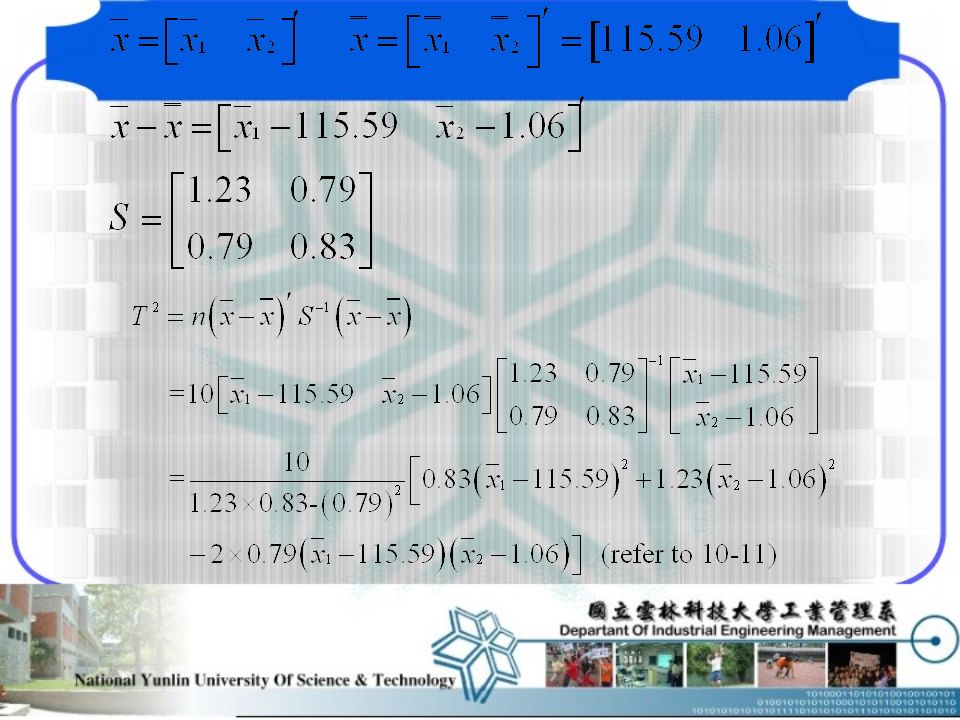
10-3.1 Subgrouped Data We have

11
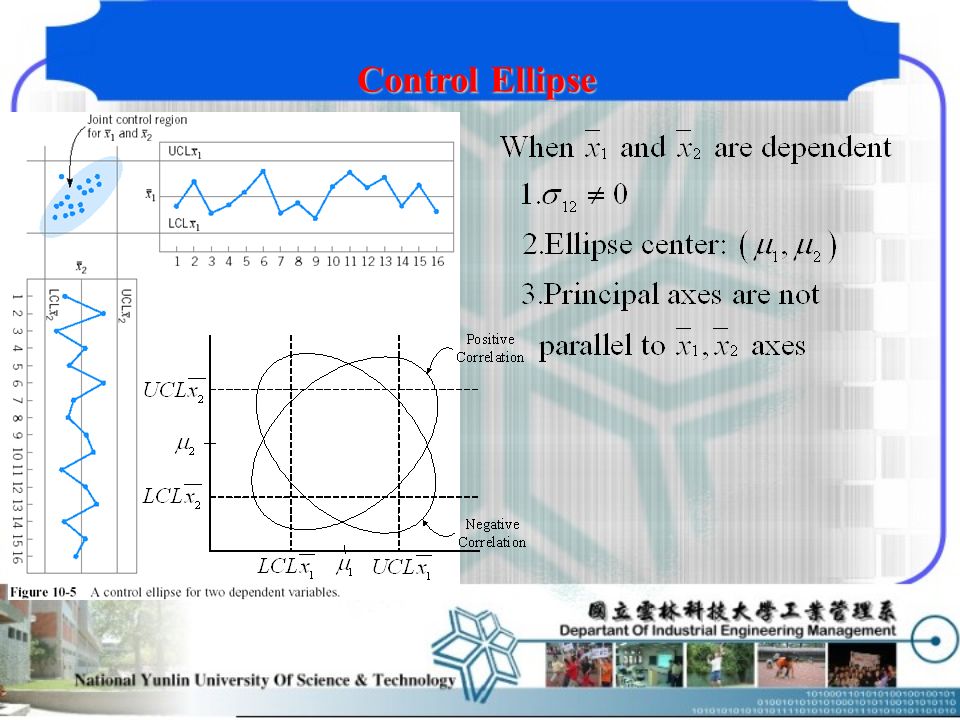
Control Ellipse

13
Disadvantage: The time sequence of the plotted points is lost Hard to deal with more than two quality characteristics Solution: chi-square control chart

14
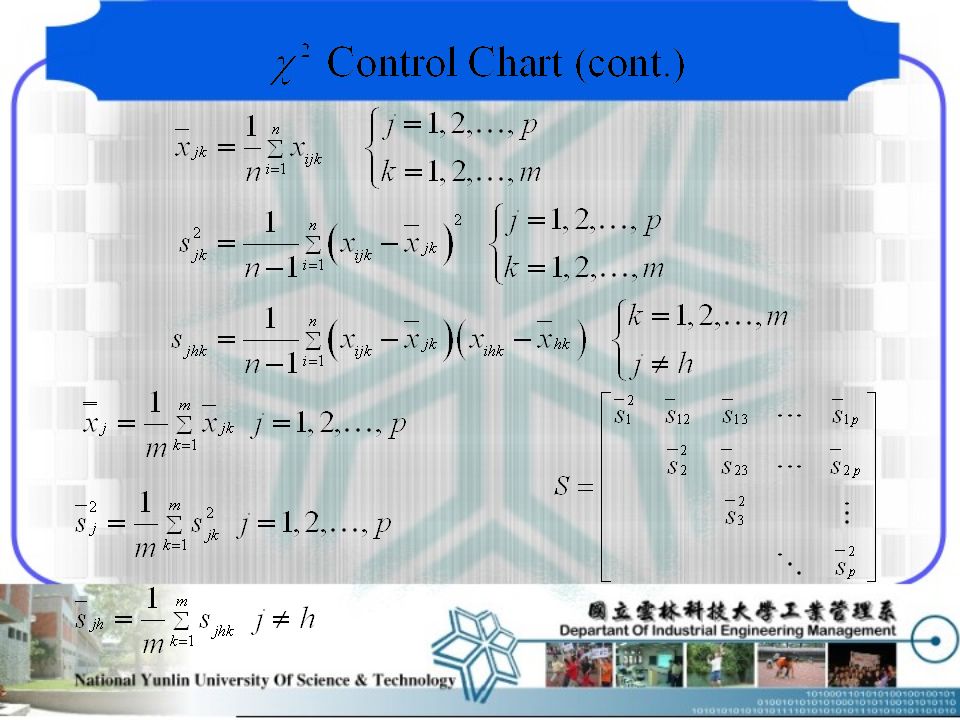
Extend to p related quality characteristics => p-variate normal distribution

17
Lowry and Montgomery (1995): m are always greater than 20, and often more than 50
: m are always greater than 20, and often more than 50")
18
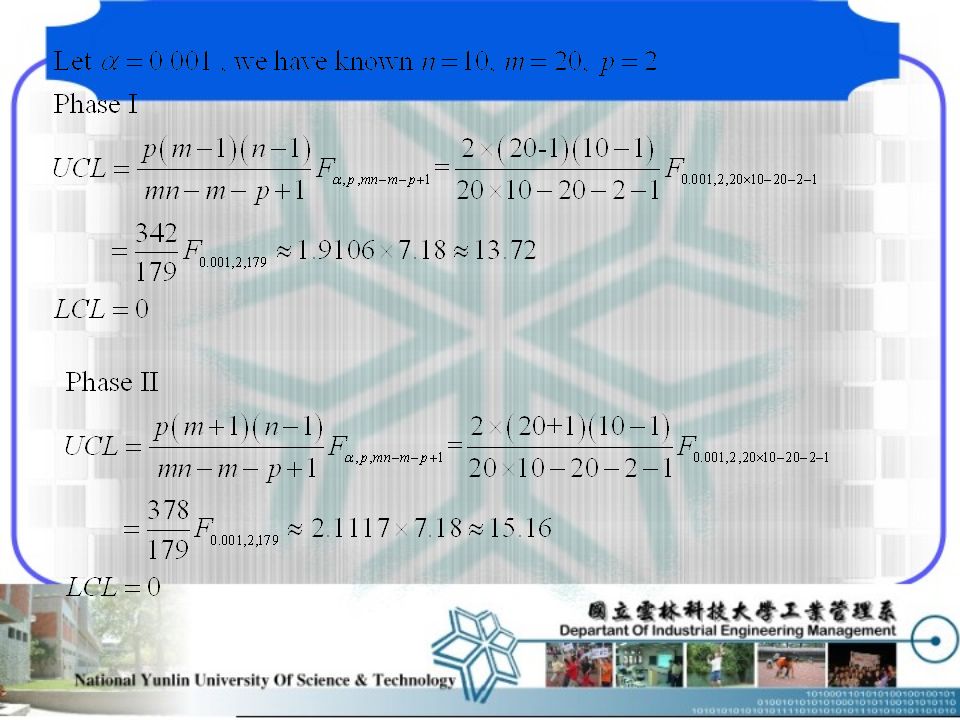
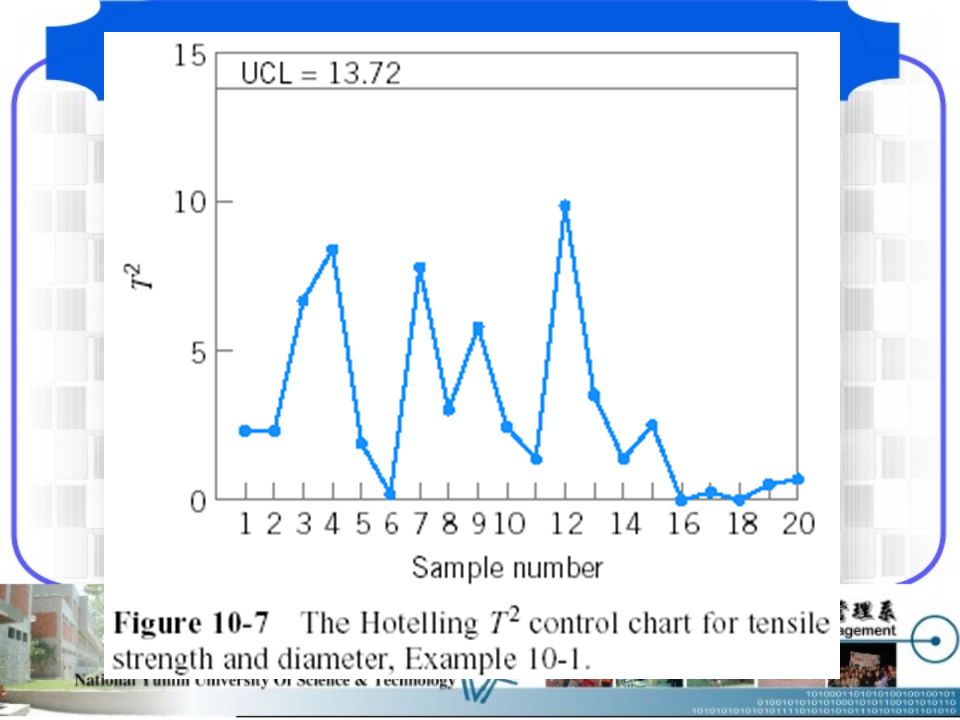
Quality Characteristics n=10 m=20

22
Interpretation of Out-of-Control Signals

23
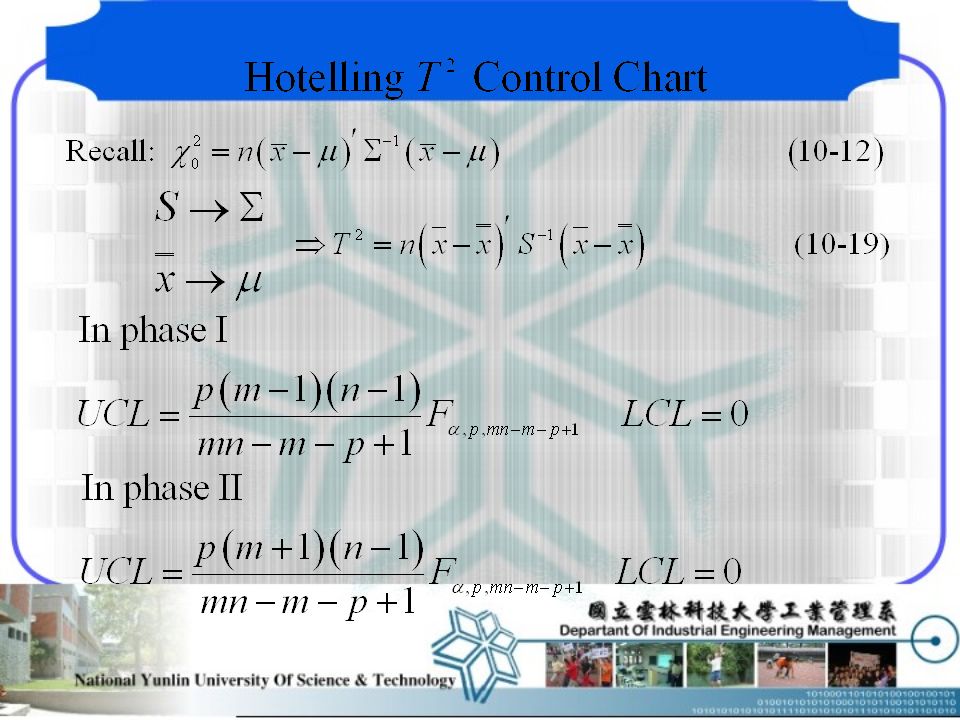
10-3.2 Individual Observations Recall control chart The phase II control limits: Subgroup size The phase II control limits:

24
10-3.2 Individual Observations(cont.) (covariance is known) Note: Lowry and Montgomery (1995) show that the chi-square limit should be applied when Tracy, Young and Mason (1992):
 (covariance is known) Note: Lowry and Montgomery (1995) show that the chi-square limit should be applied when Tracy, Young and Mason (1992):")
25
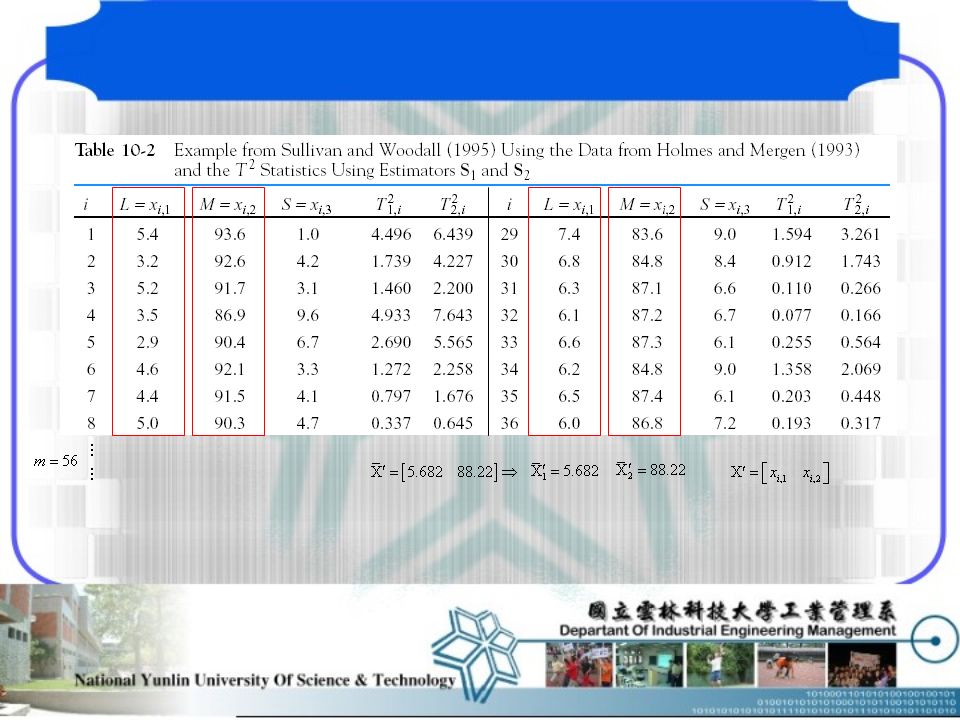
10-3.2 Individual Observations(cont.) Sullivan and Woodall (1995), Vargas (2003) Holmes and Mergen (1993)
 Sullivan and Woodall (1995), Vargas (2003) Holmes and Mergen (1993)")
27
Covariance matrices:

29
10.4 The Multivariate EWMA control chart 多變量統計製程管制圖 ~ 多變量指數加權移動平均管制圖 1931 年以來 ,有學者針對多變量品質管制發表相關研究 例如: Hotelling’s 管制圖、 MCUSUM 、及 MEWMA 等 …. 例如: Hotelling’s 管制圖、 MCUSUM 、及 MEWMA 等 …. 比較管制圖的方法是利用平均連長度( ARL ) Wieringa(1998) 對 所做的推導,由時間序列 AR ( 1 ) Wieringa(1998) 對 所做的推導,由時間序列 AR ( 1 ) Model : 令 =0 ~N ( 0 , )符合標準常態下, EWMA 管制圖定義得 課本
 Wieringa(1998) 對 所做的推導,由時間序列 AR ( 1 ) Wieringa(1998) 對 所做的推導,由時間序列 AR ( 1 ) Model : 令 =0 ~N ( 0 , )符合標準常態下, EWMA 管制圖定義得 課本.")
30
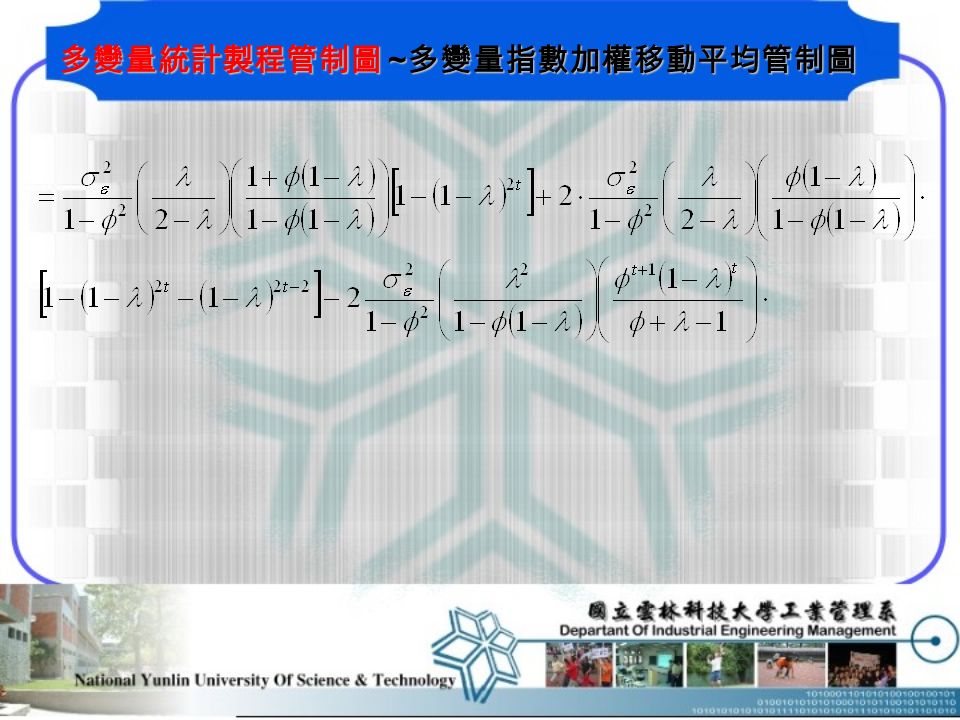
多變量統計製程管制圖 ~ 多變量指數加權移動平均管制圖 推導管制界限為 : 假設製程在時間 t=T 時發生均值的偏移

31
多變量統計製程管制圖 ~ 多變量指數加權移動平均管制圖 之值 :

32
多變量統計製程管制圖 ~ 多變量指數加權移動平均管制圖

34
The quantity plotted on the control chart is Where the covariance matrix is

35
多變量統計製程管制圖 ~ 多變量指數加權移動平均管制圖 推導過程 :

36
多變量統計製程管制圖 ~ 多變量指數加權移動平均管制圖 Given an out-of control signal is chosen to achieve a specified in-control ARL and is the covariance matrix of is the asymptotically stationary

37
多變量統計製程管制圖 ~ 多變量指數加權移動平均管制圖 當t當t where is analogous to the variance of the univariate EWMA

38
…

39
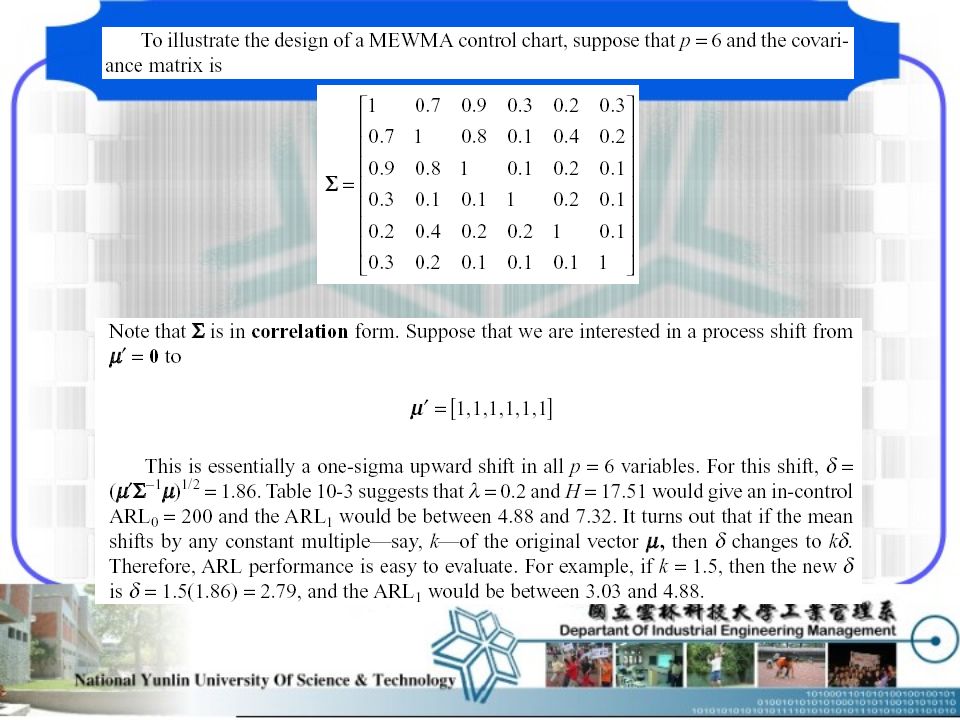
多變量統計製程管制圖 ~ 多變量指數加權移動平均管制圖 noncentrality paramater Usually called the noncentrality paramater ( 非中心參數 ) ( 非中心參數 ) The value is in-control state (because the control chart can be constructed using “standardized” data) Note that for a given shift size , ARLs generally tend to increase as increases. Since the MEWMA with =1 is equivalent to the control chart, the MEWMA is more sensitive to smaller shifts.

41
多變量統計製程管制圖 ~ 多變量指數加權移動平均管制圖

42
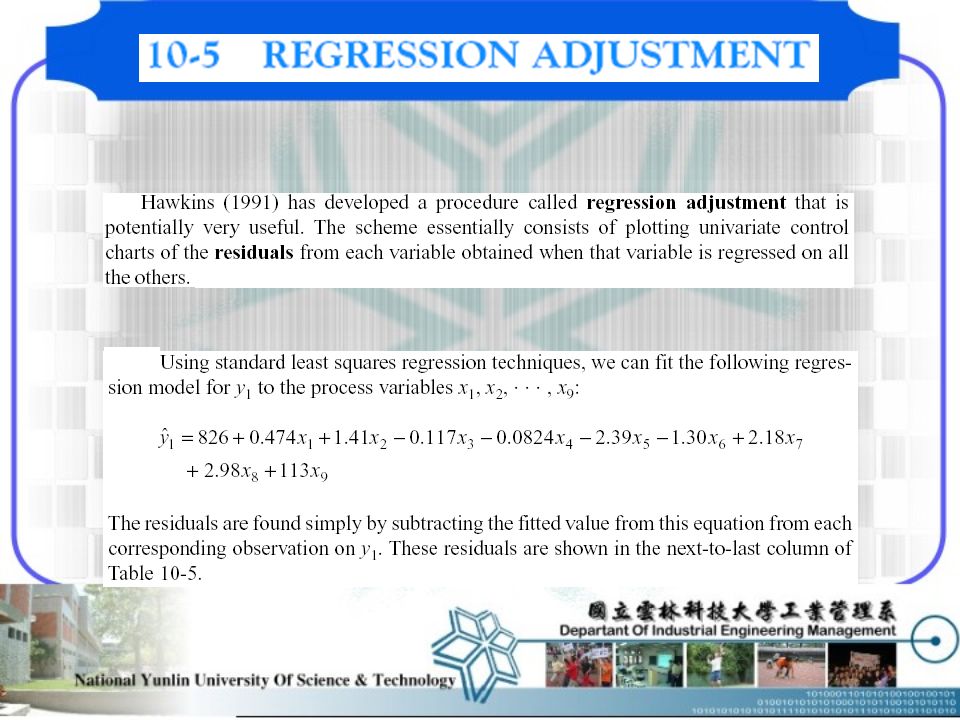
10-5 REGRESSION ADJUSTMENT Hotelling T 2 control chart - It is not necessarily an optimal control- charting procedure for detecting mean shifts - Hotelling T 2 is not optimal for more structured shifts in the mean, such as shifts in only a few of the process variables.

44
…

45
NICE FEATURE FOR REGRESSION ADJUSTMENT If the proper set of variables is included in the regression model, the residuals from the model will typically be unrelated, even though the original variable of interest y 1 exhibited correlation.

46
There is no evidence of autocorrelation in the residuals

47
Application for regression adjustment The regression adjustment has many possible applications in chemical and process plants where there are often cascade processes with several inputs but only a few out puts, and where many of the variables are highly autocorrelated. Example: 半導體製程中,其中一個重要的步驟為化學氣相沉 積 (Chemical Vapor Deposition) ,其目的在於晶圓 上沉積一層薄膜,應用了熱能、電能及光學反應, 可知薄膜厚度受到許多變因的影響,彼此之間也有 關聯性,如電壓改變會影響溫度,所以這些製程及 品質變數不完全獨立。
 ,其目的在於晶圓 上沉積一層薄膜,應用了熱能、電能及光學反應, 可知薄膜厚度受到許多變因的影響,彼此之間也有 關聯性,如電壓改變會影響溫度,所以這些製程及 品質變數不完全獨立。.")
48
10-6 Control chart for monitoring variability

49
Analogy with photographic film on which a hidden or latent image is stored as a result of light interacting with the surface of the film.

50
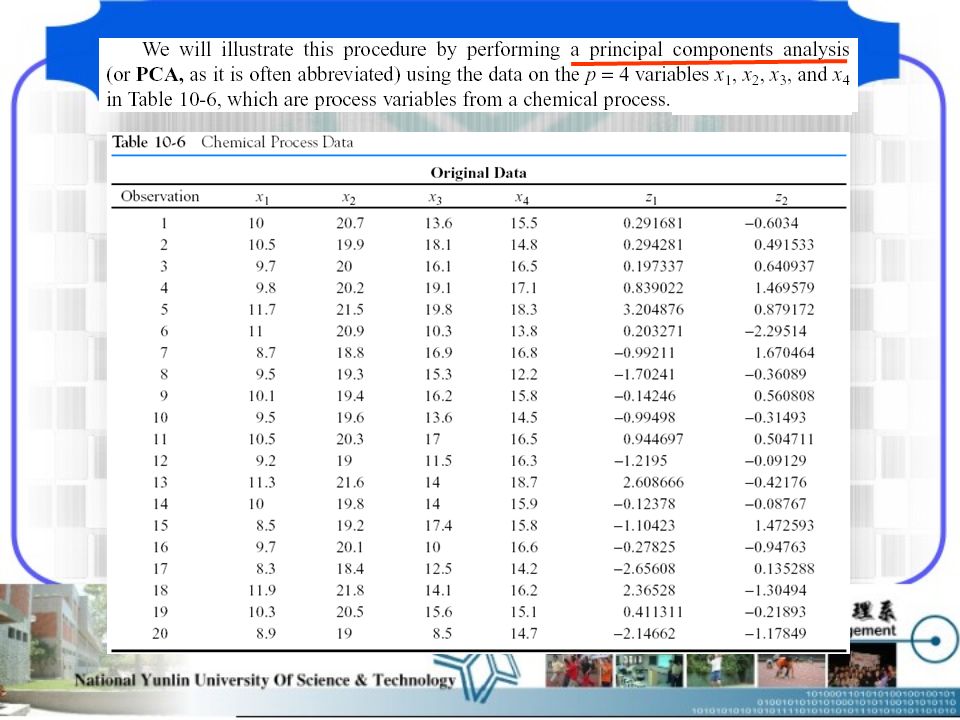
Original Variables: X 1,X 2 Principal Components: Z 1,Z 2 Original Variables: X 1,X 2, X 3 Principal Components: Z 1,Z 2 in a plane Find a new set of orthogonal directions that defines the maximum variability in the original data. Use fewer than p principal components to obtain a satisfactory description.

54
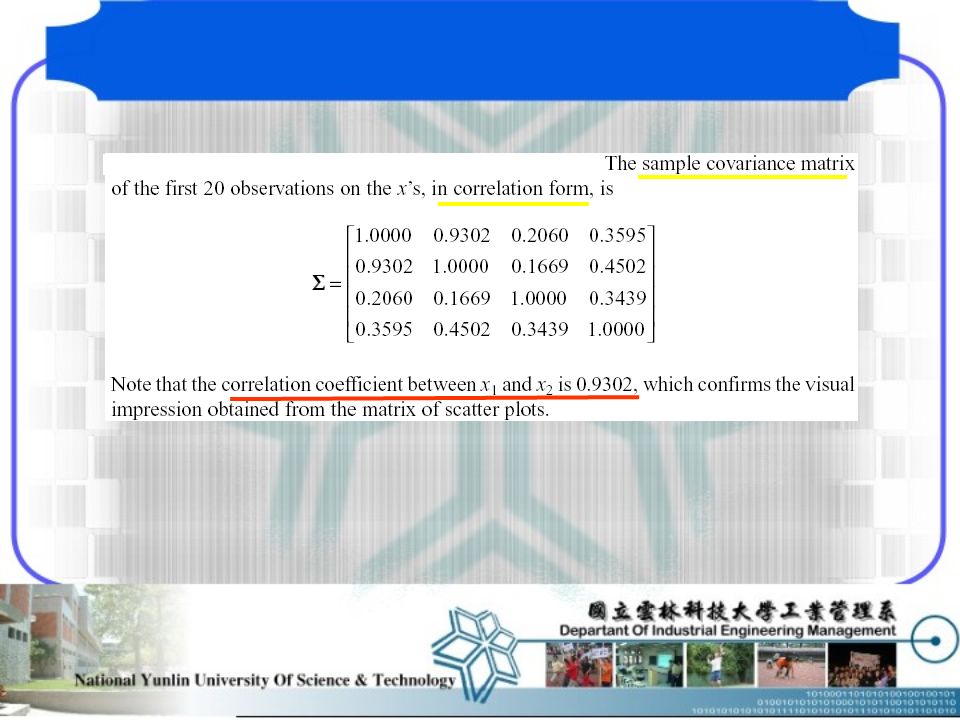
Matrix of scatter-plots: The first two variables are highly correlated. The other two variables exhibit moderate correlation.

56
Cumulative percent of first two principal components is over 83% of the variability in the original for variables.

57
The ellipse is an approximate control limit. All 20 scores are inside the ellipse.

59
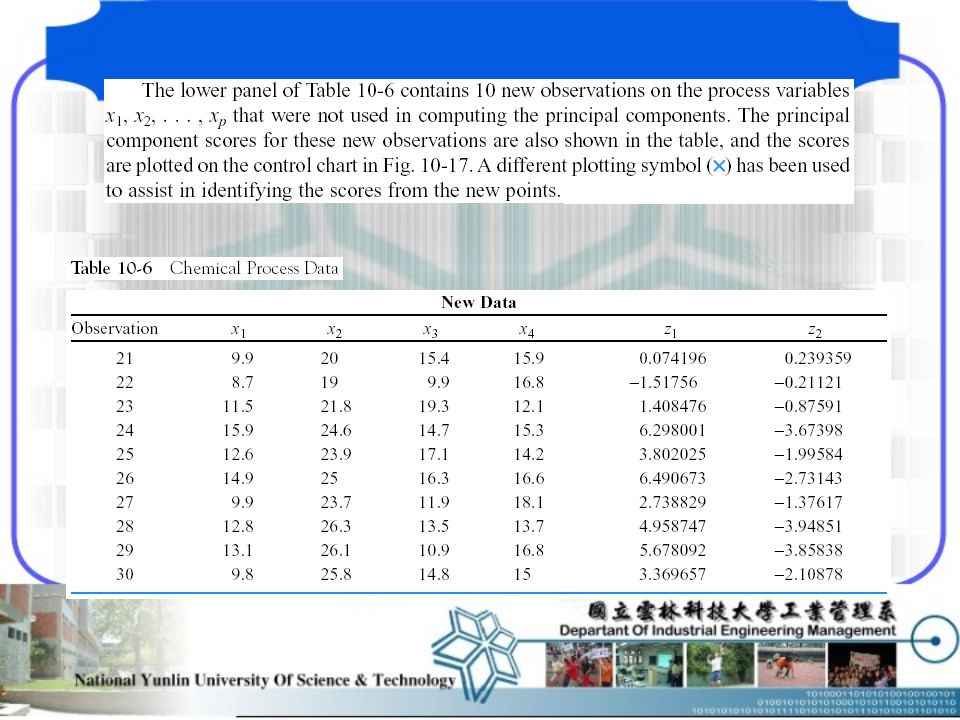
Components Trajectory Chart If scores plot outside the ellipse, then the process is out of control. Control charts and trajectory plots based on PCA will be the most effective in detecting shifts in the directions defined by the principal components.

60
Refer to the textbook, pp. 520 – 521 for more information

61
On-line monitoring when the process yields a linear profile Lan Kang; Susan L Albin Journal of Quality Technology; Oct 2000; 32, 4; ProQuest Science Journals, pg. 418

62
On the monitoring of linear profiles Keunpyo Kim; Mahmoud A Mahmoud; William H Woodall Journal of Quality Technology; Jul 2003; 35, 3; ProQuest Science Journals, pg. 317

63
聽累了ㄇ ………… 忍很久了吧 忍很久了吧 恭喜您終於聽完了 恭喜您終於聽完了 好好回家補眠吧 !! 好好回家補眠吧 !!

Similar presentations


 朝陽科技大學 資訊管理系 李麗華 教授.>")


>")


>")


