Download presentation
Presentation is loading. Please wait.

1
消費稅的基本介紹

2
They are divided into five broad categories:
In the OECD classification, “taxes” are confined to compulsory, unrequited payments to general government. They are divided into five broad categories: Income and profits tax, Payroll tax, Property tax, Consumption tax, Compulsory social security contributions.

3
一般而言,我們把租稅分成三大類別: ˍˍˍˍ、ˍˍˍˍ、ˍˍˍˍ。 ˍˍˍˍˍˍˍˍˍˍ係指對財貨或勞務銷售行為所課徵的租稅。消費稅的稅基為消費支出,換句話說,消費稅是針對所得扣除儲蓄以後的消費支出為課稅基礎。

4
消費稅一般又可分為二類: ˍˍˍˍˍˍˍˍˍˍˍˍˍˍˍˍ:將個人一定期間內(通常為一年)的消費支出總額,減除最低生活消費支出後的餘額,作為課稅的基礎,採累進課稅,稅負難以轉嫁,屬於直接稅,一般又稱為綜合型消費稅。 ˍˍˍˍˍˍˍ:對財貨或勞務的銷售行為所課徵的租稅,我們一般常聽到的消費稅即是指此類的租稅。

5
銷售稅在設計上最主要的二個問題就是ˍˍˍ(tax base)與ˍˍˍˍˍˍ(points of collection)的選擇。
稅基的選擇: 針對所有的財貨及勞務的銷售行為來課徵,稱為ˍˍˍˍˍˍˍˍˍˍˍ; 若僅針對少數幾種財貨及勞務的銷售行為來課徵,稱為ˍˍˍˍˍˍˍˍˍˍˍ。

6
多階段銷售稅可就銷售總額(毛額)課徵,亦可僅就加值額課稅。前者一般稱之為ˍˍˍˍˍˍˍˍ,後者稱之為ˍˍˍˍˍˍˍˍ。
課稅時點的選擇: 若僅就製造、批發、零售之某一階段課稅,稱為ˍˍˍˍˍˍˍˍˍˍ; 若在每一交易階段皆分別課稅,則為ˍˍˍˍˍˍˍˍˍˍˍ。 多階段銷售稅可就銷售總額(毛額)課徵,亦可僅就加值額課稅。前者一般稱之為ˍˍˍˍˍˍˍˍ,後者稱之為ˍˍˍˍˍˍˍˍ。
課徵,亦可僅就加值額課稅。前者一般稱之為ˍˍˍˍˍˍˍˍ,後者稱之為ˍˍˍˍˍˍˍˍ。")
7
The most widespread general consumption tax is theˍˍˍˍˍˍˍˍ, also called “Goods and Services Tax (GST) in several countries. After only fifty years of existence, this tax has become a key source of government revenues in more than 160 countries.

8
The VAT is implemented in 33 of the 34 OECD member countries.
Only the ˍˍˍˍˍ retained a “Sales Tax” system in which all of the tax is collected at the final stage of consumption.

9
圖 消費稅之分類

10
此外,銷售稅也可以依在國境內銷售,或國境內(外)銷售至國境外(內)加以區分。前者即一般所稱的消費稅;後者為針對財貨通過國境所課徵的租稅,一般稱為ˍˍˍˍˍˍˍˍ。
關稅又區分為: 針對出境財貨所課徵者,稱為ˍˍˍˍ; 針對入境的國外財貨課徵者,稱為ˍˍˍˍˍ; 針對外國貨物在本國國境轉口時所課徵的ˍˍˍˍ。

11
我國財政概況介紹 (http://www.mof.gov.tw/ct.asp?xItem=77475&ctNode=2856)
“Government Finance in the Republic of China 2014” 中華民國財政2014, 財政部綜合規劃司 This publication describes the major work of the Ministry of Finance in the areas of the national treasury, taxation, customs, and national property. It is published with Chinese and English text. The book includes detailed information and figures to give our readers a comprehensive overview of work performed on our national finances. (
")
12
各級政府財政歲入歲出淨額 (
")
13
Government Spending / GDP – Selected Countries
Government Spending as a Percentage of GDP, 2014 (

14
各級政府財政歲入淨額結構 2004年度(CY) NT$1927.4拾億元 (billion)100% 2013年度(CY)
(
")
15
民國102年各級政府歲入淨額,仍以___________ 、營業盈餘及事業收入為主要來源,其中稅課收入所占比重呈現上升趨勢,由93年之70
民國102年各級政府歲入淨額,仍以___________ 、營業盈餘及事業收入為主要來源,其中稅課收入所占比重呈現上升趨勢,由93年之70.2%上升至103年之____%。

16
各級政府財政歲出淨額結構 2004年度(CY) NT$2245.0拾億元 (billion)100% 2013度(CY)
(
")
17
民國102年各級政府歲出淨額,以__________支出、________支出及_________支出所占比重較大,分別占31. 9%、22
民國102年各級政府歲出淨額,以__________支出、________支出及_________支出所占比重較大,分別占31.9%、22.5%及14.8%;自93年以來,以社會安全及退撫支出及教育科學文化支出比重各增加4.2與1.6個百分點較多,而經濟發展支出比重減少3.6個百分點最多。

18
各級政府債務餘額 註:「債務餘額」依公共債務法規定,係指中央及地方政府在其總預算、特別預算及營業基金、信託基
金以外之特種基金預算內,所舉借一年以上公共債務未償餘額,但不包括其所舉借自償性公共債 務。 (
")
19
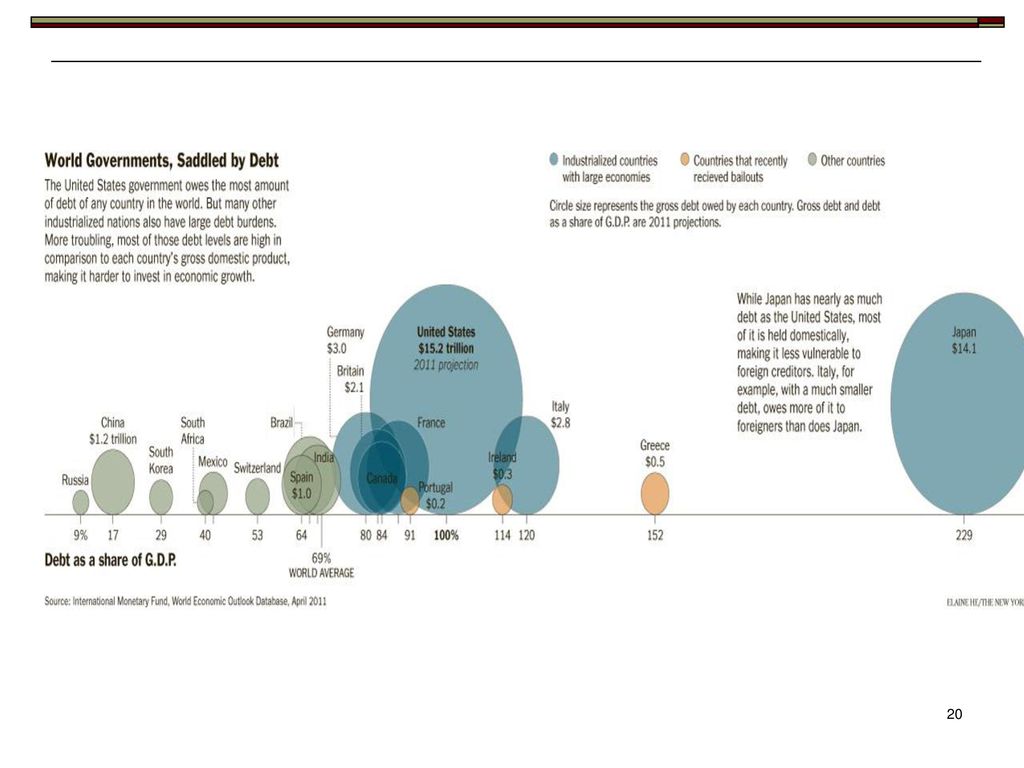
2011年各國負債概況 國家 政府公共債務 (美金) 占GDP比率 美國 15.2兆 100% 英國 2.1兆 83% 日本 14.1兆
229% 中國 1.2兆 17% 台灣 0.18兆 39% 資料來源:

21
中央政府社會安全支出結構

22
Tax System in Taiwan

24
幾個重要年度: 89會計年度以前: 國稅(中央)和地方稅(省和直轄市/縣市) 89會計年度以後: 國稅(中央)和地方稅(直轄市/縣市)
89會計年度以後將原本屬於省稅之______納入國稅。

25
89會計年度: 90會計年度: 91會計年度以前: 91會計年度以後: 100會計年度以後:

26
100會計年度以前: 100會計年度以後: 104會計年度以後:

27
Ex:各級政府財政歲入歲出淨額

28
賦稅收入成長概況 (資料來源:中華民國財政2014-賦稅收入)
")
29
賦稅收入結構 2004年度(CY) NT$1,387.3拾億元 2004年度(CY) (billion)100% NT$1,387.3拾億元
(
")
30
民國102年賦稅收入以_______占40. 5%最大,較93年增加7. 6個百分點,其次為________占16. 5%,較93年減少0
民國102年賦稅收入以_______占40.5%最大,較93年增加7.6個百分點,其次為________占16.5%,較93年減少0.3個百分點,關稅占5.3%,較93年減少0.4個百分點,貨物稅所占比重亦逐漸降低,顯示賦稅結構已有顯著變化。

31
主要賦稅收入成長趨勢

32
Trends in the Growth of Major Taxes
單位:新台幣拾億元 單位:新台幣拾億元

33
The tax structure has changed in recent years.
隨景氣復甦,民國102年各稅收入大多較101 年增加,其中貨物稅增加0.99%,關稅增加2.21%,營業稅增加7.52%,土增稅增加27.37%,而所得稅減少2.3%,證券交易稅減少0.7%。 資料來源:中華民國財政2013-賦稅收入

34
直接稅與間接稅比重

35
In the past ten years, due to government efforts in improving the tax structure and in strengthening the collection of income tax each year, revenue from direct taxes as a percentage of total tax revenues has risen. In CY 2013, total revenues from _______ taxes rose to 59.5%, an increase of 3.7 percentage points compared with CY 2004.

36
賦稅收入之相對百分比

37
平均每人稅負及平均每人所得

38
選樣國家租稅負擔比較

39
目前在我國現行租稅中,有關消費稅性質的稅目計有:
其中,以ˍˍˍˍ為最大消費稅稅收來源。

40
併入國稅

41
2013

42
稅 目 別 99年 100年 101年 102年 CY 2010 CY 2011 CY 2012 CY 2013 金額(單位:千元) 百分比(%) 總 計 1,622,244,070 100.0 1,764,610,616 1,796,697,193 1,834,124,153 一、稅課收入 1,565,847,055 96.5 1,703,988,545 96.6 1,733,349,863 1,768,816,736 96.4 (一)國 稅 1,292,838,818 79.7 1,423,444,129 80.7 1,447,899,812 80.6 1,448,390,897 79.0 關 稅 89,484,228 5.5 96,322,743 94,918,150 5.3 97,008,695 所 得 稅 590,387,476 36.4 710,191,056 40.2 760,809,633 42.3 743,289,569 40.5 營利事業所得稅 285,701,268 17.6 367,186,074 20.8 367,744,332 20.5 351,115,287 19.1 綜合所得稅 304,686,208 18.8 343,004,982 19.4 393,065,301 21.9 392,174,282 21.4 遺產及贈與稅 40,329,876 2.5 23,658,842 1.3 28,280,408 1.6 23,727,917 遺產稅 31,264,086 1.9 15,847,227 0.9 19,276,361 1.1 14,076,799 0.8 贈與稅 9,065,790 0.6 7,811,615 0.4 9,004,047 0.5 9,651,118 營 業 稅 268,213,690 16.5 283,884,285 16.1 281,817,236 15.7 303,039,378 貨 物 稅 150,777,174 9.3 164,876,634 160,897,298 9.0 162,503,713 8.9 菸 酒 稅 44,516,115 2.7 44,660,361 44,938,842 44,769,009 2.4 證券交易稅 104,574,112 6.4 93,990,479 71,940,358 4.0 71,383,425 3.9 期貨交易稅 4,556,136 0.3 5,859,643 4,297,887 0.2 2,669,191 0.1 礦 區 稅 11 0.0 86 - (二)直轄市及縣(市)稅 273,017,088 16.8 280,543,298 15.9 285,447,913 320,424,641 17.5 土 地 稅 136,356,984 8.4 141,981,922 8.0 143,848,851 174,080,706 9.5 地價稅 63,044,266 63,374,107 3.6 62,712,169 3.5 70,826,019 土地增值稅 73,312,718 4.5 78,607,815 81,136,682 103,254,687 5.6 房 屋 稅 58,202,695 59,466,872 3.4 61,796,279 63,013,454 使用牌照稅 54,051,738 3.3 55,380,372 3.1 56,533,991 57,759,406 契 稅 13,815,457 12,640,465 0.7 11,693,005 13,560,334 印 花 稅 8,944,538 9,397,243 10,009,459 10,376,985 娛 樂 稅 1,645,676 1,676,424 1,566,328 1,633,756 (三)教 育 捐 -8,851 -0.0 1,118 2,138 1,198 二、金融保險業營業稅 21,602,057 23,806,475 24,719,963 1.4 24,931,718 三、健康福利捐 34,794,958 2.1 34,609,126 2.0 34,352,076 35,057,254 四、特種貨物及勞務稅 2,206,470 4,275,291 5,318,445
國 稅. 1,292,838, ,423,444, ,447,899, ,448,390, 關 稅. 89,484, ,322, ,918, ,008,695. 所 得 稅. 590,387, ,191, ,809, ,289, 營利事業所得稅. 285,701, ,186, ,744, ,115, 綜合所得稅. 304,686, ,004, ,065, ,174, 遺產及贈與稅. 40,329, ,658, ,280, ,727,917. 遺產稅. 31,264, ,847, ,276, ,076, 贈與稅. 9,065, ,811, ,004, ,651,118. 營 業 稅. 268,213, ,884, ,817, ,039,378. 貨 物 稅. 150,777, ,876, ,897, ,503, 菸 酒 稅. 44,516, ,660, ,938, ,769, 證券交易稅. 104,574, ,990, ,940, ,383, 期貨交易稅. 4,556, ,859,643. 4,297, ,669, 礦 區 稅 - (二)直轄市及縣(市)稅. 273,017, ,543, ,447, ,424, 土 地 稅. 136,356, ,981, ,848, ,080, 地價稅. 63,044, ,374, ,712, ,826,019. 土地增值稅. 73,312, ,607, ,136, ,254, 房 屋 稅. 58,202, ,466, ,796, ,013,454. 使用牌照稅. 54,051, ,380, ,533, ,759,406. 契 稅. 13,815, ,640, ,693, ,560,334. 印 花 稅. 8,944,538. 9,397, ,009, ,376,985. 娛 樂 稅. 1,645,676. 1,676,424. 1,566,328. 1,633,756. (三)教 育 捐. -8, ,118. 2,138. 1,198. 二、金融保險業營業稅. 21,602, ,806, ,719, ,931,718. 三、健康福利捐. 34,794, ,609, ,352, ,057,254. 四、特種貨物及勞務稅. 2,206,470. 4,275,291. 5,318,445.")
43
Table C. Tax structures in the OECD-area 1
Tax structures in OECD Table C. Tax structures in the OECD-area 1 1965 1975 1985 1995 2005 2010 2012 Personal income tax 26 30 24 25 Corporate income tax 9 8 10 Social security contributions 2 18 22 (employee) ( 6) ( 7) ( 9) ( 10) (employer) ( 14) ( 13) ( 15) Payroll taxes 1 Property taxes 6 5 General consumption taxes 12 13 16 19 20 Specific consumption taxes 11 Other taxes 3 2 3 Total 100 1. Percentage share of major tax categories in total tax revenue. Data are included from 1965 onwards for Australia, Austria, Belgium, Canada, Denmark, Finland, France, Germany, Greece, Iceland, Ireland, Italy, Japan, Luxembourg, the Netherlands, New Zealand, Norway, Portugal, Spain, Sweden, Switzerland, Turkey, United Kingdom and United States; from 1972 for Korea; from 1980 for Mexico; from 1990 for Chile; from 1991 for Hungary and Poland; from 1993 for the Czech Republic and from 1995 for Estonia, Israel, the Slovak Republic and Slovenia. 2. Including social security contributions paid by the self-employed and benefit recipients (heading 2300) that are not shown in the breakdown over employees and employers. 3. Including certain taxes on goods and services (heading 5200) and stamp taxes. Source : Tables 10, 12, 14, 16, 18, 20, 22, 28 and 30 in Section II.A. (Source:
 ( 6) ( 7) ( 9) ( 10) (employer) ( 14) ( 13) ( 15) Payroll taxes. 1. Property taxes General consumption taxes Specific consumption taxes. 11. Other taxes Total Percentage share of major tax categories in total tax revenue. Data are included from 1965 onwards for Australia, Austria, Belgium, Canada, Denmark, Finland, France, Germany, Greece, Iceland, Ireland, Italy, Japan, Luxembourg, the Netherlands, New Zealand, Norway, Portugal, Spain, Sweden, Switzerland, Turkey, United Kingdom and United States; from 1972 for Korea; from 1980 for Mexico; from 1990 for Chile; from 1991 for Hungary and Poland; from 1993 for the Czech Republic and from 1995 for Estonia, Israel, the Slovak Republic and Slovenia. 2. Including social security contributions paid by the self-employed and benefit recipients (heading 2300) that are not shown in the breakdown. over employees and employers. 3. Including certain taxes on goods and services (heading 5200) and stamp taxes. Source : Tables 10, 12, 14, 16, 18, 20, 22, 28 and 30 in Section II.A. (Source:")
44
Consumption taxes in OECD
In the statistical nomenclature of the OECD, consumption taxes can be split into two types: General consumption tax, typically Value Added Tax (VAT) and its equivalent, the Goods and Services Tax (GST). This category also includes the “sales tax” collected by sate and local authorities in the US, which is also levied on consumption but differs significantly from VAT.
 and its equivalent, the Goods and Services Tax (GST). This category also includes the sales tax collected by sate and local authorities in the US, which is also levied on consumption but differs significantly from VAT.")
45
Taxes on specific goods and services, consisting primarily of excise taxes. It also includes customs duties and certain special taxes on insurance or financial operations.

46
Share of consumption taxes as % of total taxation
(

47
If we look at the unweighted average of revenue from both these categories of taxes as a percentage of overall taxation in the OECD member countries, it can be seen that the proportion is roughly 30%. In 2012, this amount can further break down to one-third for taxes on specific goods and services, and two-thirds for general consumption taxes.

48
Standard Rates of VAT, 2014

49
Rates and structure of VAT
The evolution of VAT rates can be divided into 3 periods: : Many countries first implemented their VAT system, many countries progressively raised their standard rates. In this period, the OECD average standard rates rose from 15.6% to 18%. : the standard rate of VAT remained stable in most countries, only 5 countries had a stand rate above 22% (Demark, Finland, Iceland, Norway and Sweden). In this period, the OECD standard rate declined slightly from 18% to 17.6%.
. In this period, the OECD standard rate declined slightly from 18% to 17.6%.")
50
Rates and structure of VAT
: In this period, it is marked by a strong increase in the standard VAT rate in many countries in response to financial consolidation pressures caused by the economic and financial crisis. While most OECD countries have increased their standard VAT rates at least once between 2009 to 2014, there are still major differences in standard rates among OECD countries, with the rates ranging from 5% in Canada, and 8% in Japan and Switzerland, 25%in Denmark, Norway and Sweden, 25.5% in Iceland, and even 27% in Hungry. The unweighted OECD average standard VAT rate reached a hike of 19.1% in January 2014.

Similar presentations


 主讲:闫爱华>")


>")